Figures & data
Table 1. Primers used for virus detection in real-time PCR.
Figure 1. Virus titration, host cell viability and morphology at differential time intervals after CPV infection. (a) Standard curve and virus titration as detected using qPCR in CRFK and MDCK cells. (b) Virus titration as detected using PCR gel electrophoresis in CRFK and MDCK cells. (c) Host cell viabilities after CPV infection in CRFK and MDCK cells. (d) Host cell morphological images on CPV infection for MDCK and CRFK cells. The viral gene used for virus quantification was ‘VP2ʹ.
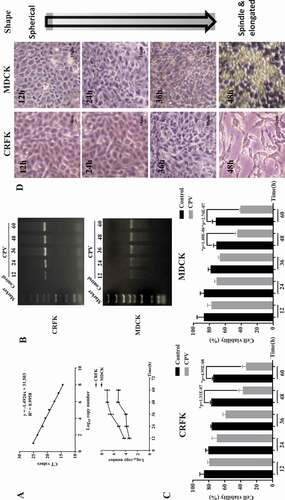
Figure 2. CPV-induced G1/S cell cycle arrest. Flow cytometry images showing CVP-induced G1/S cell cycle arrest in (a) CRFK and (b) MDCK cells. (c) Expression of key G1/S cell cycle arrest-related proteins. Each experiment was repeated 3 times, with one being shown in this figure. The pie chart was constructed by taking an average of each percentage from all repeats. Quantification results were prepared by normalizing cyclin D1 and p27 expression by GAPDH expression.
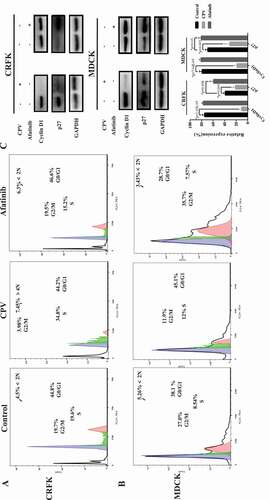
Figure 3. Expression of proteins relevant to DNA replication and cell proliferation on CPV infection or Afatinib exposure in (a) CRFK cells and (b) MDCK cells. Quantification results were prepared by normalizing PCNA and POLE2 expression by GAPDH expression.
Figure 4. Cellular response to CPV infection. (a) Membrane potential, (b) intracellular Ca2+ level, and (c) intracellular ROS level on CPV infection.
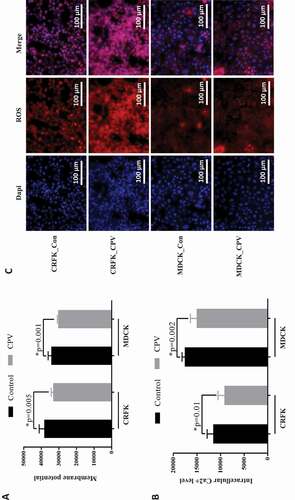
Figure 5. EGFR total protein expression level and phosphorylation status on CPV infection. Expression of EGFR protein and EGFR phosphorylation status at Y1086, Y1068, Y1148 on CPV infection and being treated with Afatinib in (a) CRFK cells and (b) MDCK cells. Afatinib is an EGFR tyrosine phosphorylation inhibitor. Quantification results were prepared by normalizing EGFR expression and phosphorylation by GAPDH expression.
Figure 6. STAT3 total protein expression level and phosphorylation status on CPV infection. Expression of STAT3 protein and STAT3 phosphorylation status at Y705 on CPV infection and being treated with Afatinib in (a) CRFK cells and (b) MDCK cells. Afatinib is an EGFR tyrosine phosphorylation inhibitor. Quantification results were prepared by normalizing STAT3 expression and phosphorylation by GAPDH expression.
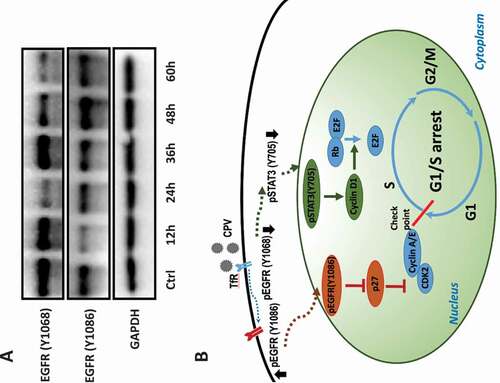
Figure 7. Conceptual scheme of CPV-triggered G1/S cell cycle arrest and kinetics of EGFR activation throughout virus life cycle. (a) Western blots showing EGFR phosphorylation status at Y1086 and Y1068 at different time points after CPV infection in CRFK cells. (b) Conceptual scheme of CPV-triggered G1/S cell cycle arrest via the EGFR(Y1086)/p27 and STAT3(Y705)/cyclin D1 axes. CPV binds to TfR on infection that triggers EGFR (Y1086) phosphorylation and EGFR (Y1068) de-phosphorylation. Phosphorylated EGFR (Y1086) is translocated to the nucleus where it contributes to reduced p27 expression; dephosphorylated EGFR (Y1068) is associated with reduced STAT3 (Y705) phosphorylation and decreased cyclin D1. Reduced p27 and cyclin D1 expression ultimately leads to cell cycle arrest at the G1/S stage.