
Figures & data
Table 1. Strains used in this study.
Figure 1. Morphological, growth and virulence characterization of the parental ExPEC PCN033 strain and the tat mutant (Δtat).
(a). Cell morphology analysis. Cells of WT, Δtat and its complement (CΔtat) strains were grown to mid-log phase and stained with regular Gram staining procedures followed by imaging using a light microscope. (b). Growth curves. Cells of WT, Δtat and CΔtat strains were subcultured from overnight-grown cultures into LB and incubated at 37°C with shaking. Optical density at a wavelength of 600 nm was measured at each indicated time point. The assay was performed in triplicate. (c). Survival rate. Mice were intraperitoneally injected with 6 × 10⁶ CFU of WT and Δtat strains, respectively. The survival rate was recorded for 5 days. (d). Bacterial load. Mice were intraperitoneally injected with 6.7 × 10⁵ cells (a non-lethal dose) of WT and Δtat strain, respectively. The mice were euthanized at each indicated time points and the organs were collected, weighed, homogenized in sterile saline, and plated on to LB for cell counting. * represents p value <0.05; ** represents p value <0.01, *** represents p value <0.0001.
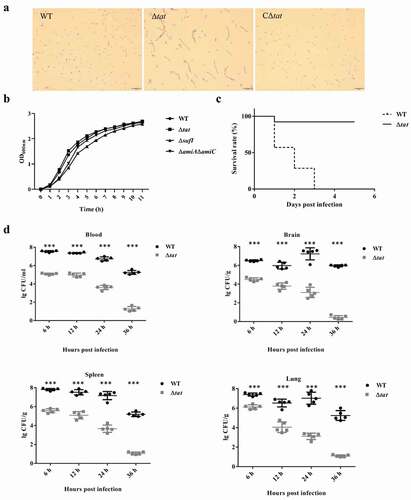
Table 2. Predicted Tat substrates encoded in ExPEC PCN033 genome.
Table 3. Competitive index (n = 5).
Figure 2. Colonization of WT, ΔsufI, and ΔamiAΔamiC strains in mouse.
Mice were intraperitoneally injected with 9.4 × 10⁵ CFU of WT, ΔsufI, and ΔamiAΔamiC strains, respectively. The mice were euthanized at each indicated time points and the organs were collected, weighed, homogenized in sterile saline, and plated on to LB for cell counting. * represents p value <0.05; ** represents p value <0.01, *** represents p value <0.0001.
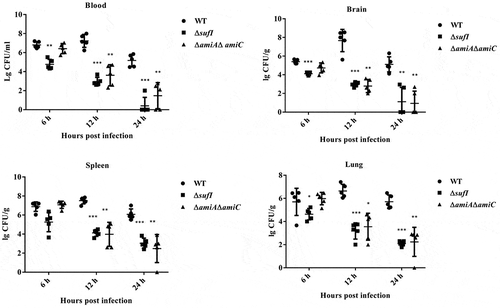
Figure 3. In vitro cell adhesion, and whole blood and serum bactericidal assays. (a). In vitro cell adhesion.
PK-15 cells and BHK-21 cells grown in 6-well plates were infected with cells of each indicated bacterial strain grown to mid-log phase with a ratio of 10:1 followed by incubation at 37°C with 5% CO2 for 2 hours. The cells were then washed with PBS and lysed with sterile water. The input bacterial cells and the cell lysates were then diluted and plated onto LB plates for bacterial enumeration. The adhesion rate of the WT strain was set as 100%. (b). Whole blood bactericidal assay. Bacterial cells of each indicated strain grown to mid-log phase were incubated with heparinized mouse whole blood at 37°C for 1 hour. The initial input and the incubated samples were then diluted and plated onto LB plates for bacterial enumeration. (c). Serum blood bactericidal assay. Bacterial cells of each indicated strain grown to mid-log phase were incubated with normal mouse serum (NS) at 37°C for 1 hour. A control in which the WT strain was incubated with heat-inactivated serum (IS) was performed in parallel. The samples were then diluted and plated onto LB plates for bacterial enumeration. The initial input and the incubated samples were then diluted and plated onto LB plates for bacterial enumeration. The assays were performed in triplicate. The survival rate was calculated as (CFUrecovered/CFUinput) × 100. * represents p value <0.05; ** represents p value <0.01, *** represents p value <0.0001.
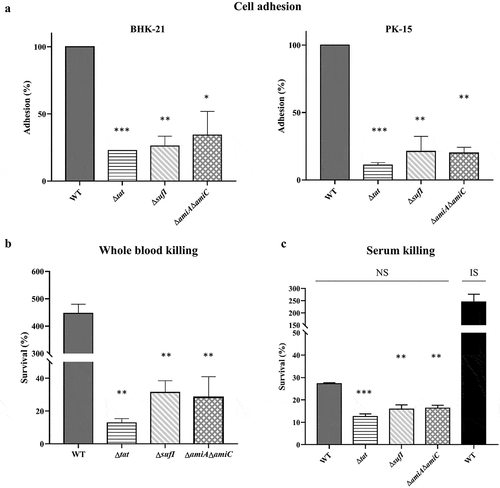
Figure 4. Motility assay.
The cells of WT, Δtat, CΔtat, ΔsufI, CΔsufI and ΔamiAΔamiC strains were grown to mid-log phase and spotted onto agar plate containing 10 g/L tryptone, 5 g/L yeast extract, 5 g/L NaCl, 0.5% glucose (w/v), and 0.45% agar (w/v). The plate was photographed after incubation at 37°C for 8 h. The diameters of the zone were measured. The assay was performed in triplicate.
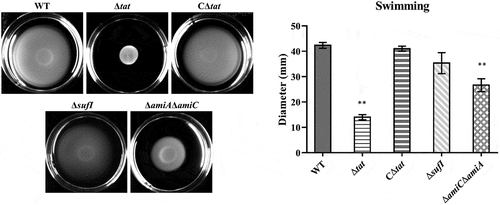
Figure 5. Live cell imaging of WT, Δtat, CΔtat, ΔsufI, and ΔamiAΔamiC strains.
Cells of WT, Δtat, CΔtat, ΔsufI, and ΔamiAΔamiC strains containing pQE80Apra-GFP plasmid were cultured in LB at 37°C with shaking. Cells were taken at each indicated time point and imaged using a fluorescent microscope.
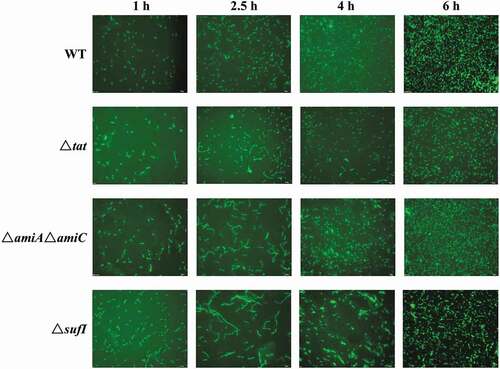
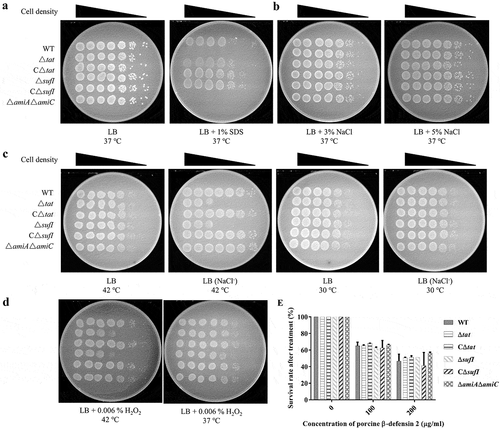
Figure 6. Stress response assay. (a). SDS resistance.
Cells of WT, Δtat, CΔtat, ΔsufI, CΔsufI, and ΔamiAΔamiC strains at mid-log phase were serially diluted and 3 μL of each culture was spotted onto LB plate containing 2% SDS which were incubated at 37°C overnight. (b). High osmotic stress response. Cells of WT, Δtat, CΔtat, ΔsufI, CΔsufI, and ΔamiAΔamiC strains at mid-log phase were serially diluted and 3 μL of each culture was spotted onto LB plate containing 3% or 5% NaCl which were incubated at 37°C overnight. (c). Low osmotic and high-temperature stresses response. Cells of WT, Δtat, CΔtat, ΔsufI, CΔsufI, and ΔamiAΔamiC strains at mid-log phase were serially diluted, and 3 μL of each culture was spotted onto LB plate with or without NaCl which were incubated at 30°C or 42°C overnight. (d). Oxidized stress response. Cells of WT, Δtat, CΔtat, ΔsufI, CΔsufI, and ΔamiAΔamiC strains at mid-log phase were serially diluted and mixed with 0.006% H2O2, and 3 μL of each culture was spotted onto LB plate with or without NaCl which were incubated at 30°C or 42°C overnight. E. Antimicrobial peptide resistance. 5 × 10³ CFU of cells of WT, Δtat, CΔtat, ΔsufI, CΔsufI, and ΔamiAΔamiC strains at mid-log phase were mixed with different concentrations of synthetic porcine β defensin at 37°C for 1 hour, and the samples were plated onto LB plates and the viable cells were counted. The assay was performed in triplicate.
Supplemental material