Figures & data
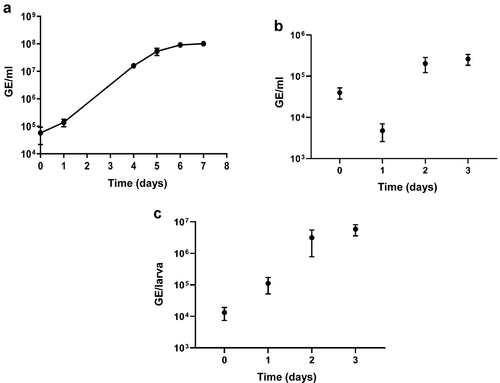
Figure 1. Expansion of C. burnetii NMII in ACCM-2 medium or in G. mellonella larvae. Larvae were injected with 106 GE of bacteria and bacteria were enumerated by qPCR at times indicated. (a) number of bacteria in ACCM-2; mean and SEM of triplicates (b) number of bacteria in G. mellonella hemocytes; mean and SEM from 3 larvae (c) number of bacteria in G. mellonella whole larvae homogenates; mean and SEM from 6 larvae.

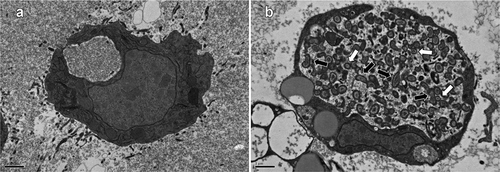
Figure 2. Transmission electron microscopy of G. mellonella hemocytes postinfection with C. burnetii. G. mellonella larvae were injected with C. burnetii NMII at a dose of 106 GE/larvae and at 3 days postinfection larvae were bled, and hemocytes visualized by a transmission electron microscope. (a) Uninfected controls with no bacteria being visible. (b) Hemocytes from infected larvae with a Coxiella-containing vacuole clearly visible, which spread to fill the entire cell cytoplasm. Arrows indicate proposed LCVs (black) and SCVs (white). Images shown are representative of 50 control images and 50 images of infected hemocytes. Scale bar = 1 μm.

Figure 3. Significantly upregulated T4SS effectors in G. mellonella, in BGM cells and in mice. Datasets compared included the RNASeq results described in this study, as well as microarray data of infected BGM cells and mice performed by Kuley et al. 2015 [Citation50], as described in Supplementary Table S7.
![Figure 3. Significantly upregulated T4SS effectors in G. mellonella, in BGM cells and in mice. Datasets compared included the RNASeq results described in this study, as well as microarray data of infected BGM cells and mice performed by Kuley et al. 2015 [Citation50], as described in Supplementary Table S7.](/cms/asset/6e5480ff-3f5c-4603-9773-fa9e90a216f8/kvir_a_1819111_f0003_oc.jpg)
Table 1. Genes commonly upregulated in G. mellonella, BGM cells, and mice. Light shaded cells show genes that were 2- to 10-fold upregulated and dark shaded cells show genes that were more than 10-fold upregulated. In all cases, gene expression was compared to bacteria grown in ACCM-2 medium for 7 days (G. mellonella data) or grown to stationary phase in ACCM-2 (BGM cells or mice data). The BGM and mice data is adapted from Kuley et al. [Citation50]. Detailed expression data for these genes are found in Supplementary Table S3.
