
Figures & data
Table 1. Demographic and clinical characteristics of IPA and non-IPA patients.
Figure 1. Detection of proteins in human BAL samples by LC-MS/MS analysis. (a) Total numbers of identified proteins in each patient sample. (b) Volcano plot of proteins with different abundance in infected versus non-infected samples. The adjusted p-value is plotted against the expression fold change of all detected proteins within the different groups. Data points in the lower center area of the plots (empty circles) display unchanged or proteins with no significant fold change. Data points in the upper quadrants indicate proteins (filled circles) with significant negative (left) and positive (right) changes in protein abundances, respectively. (c) Graphical overview of the numbers of proteins with increased abundance (Up) and decreased abundance (Down) in IPA patients compared to the control group.
Figure 2. Proteins with most significant differential abundance determined by LC-MS/MS analysis in human BAL samples. (a) Heat map of the 30 most abundant proteins during IPA. Levels of proteins with significantly increased abundance in each patient sample are visualized by LFQ intensities with a significant fold change >2 of the IPA group vs non-IPA group. FC values are fold changes. (b) The most significantly overrepresented GO terms of highly abundant proteins for biological process, molecular function and cellular component were determined with an adjusted p-value < 0.05. A full list of overrepresented proteins and GO terms are provided in Supplementary Tables 2 and 3.
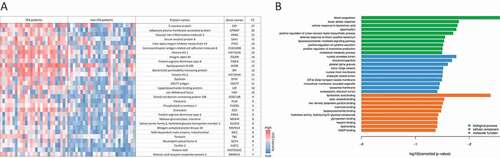
Table 2. Common host proteins that were significantly upregulated during IPA in both human and mice.
Figure 3. Detection of proteins in murine BAL samples after pulmonary infection with A. fumigatus by LC-MS/MS analysis. (a) Fungal infection of murine lungs visualized by in vivo imaging in five exemplary mice of the infection group versus five mice of the exposition group. (b) Total numbers of identified proteins in each mouse sample. (c) Volcano plot of differentially expressed proteins from infected versus non-infected mice. The adjusted p-value is plotted against the abundance fold change of all detected proteins within the different groups. Data points in the lower center area of the plots (gray) display unchanged or proteins with no significant fold change. Data points in the upper quadrants indicate proteins (filled circles) with significant negative (left) and positive (right) changes in protein abundances, respectively. (d) Graphical overview of the numbers of proteins with increased (Up) and decreased (Down) abundance in samples from infected mice compared to non-infected mice. (e) Volcano plot of differentially abundant proteins from infected versus exposed mice. The adjusted p-value is plotted against the abundance fold change of all detected proteins within the different groups. Data points in the lower center area of the plots (gray) display unchanged or proteins with no significant fold change. Data points in the upper quadrants indicate proteins (filled circles) with significant negative (left) and positive (right) changes in protein abundances, respectively. (f) Graphical overview of the numbers of proteins with increased (Up) and decreased (Down) abundance in samples from infected mice compared to exposed mice.
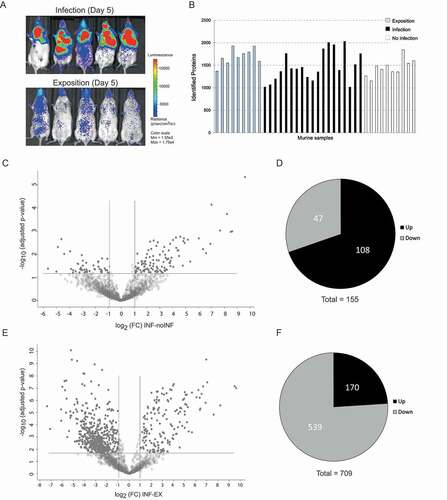
Figure 4. Proteins with most significant differential abundance in infected versus non-infected mice determined by LC-MS/MS analysis. (a) Heat map of the Top 30 abundant proteins during IPA. Abundance of significantly upregulated proteins in each animal sample are visualized by LFQ intensities with a significant fold change (FC) >2 between infected and non-infected group. The asterisk indicates proteins that were also significantly increased in comparison to the exposed group in comparison to the exposed group. (b) The most significantly overrepresented GO terms of highly abundant proteins for biological process, molecular function and cellular component were determined with an adjusted p-value. A full list of proteins with significantly differential abundance is provided in Supplementary Table 4.
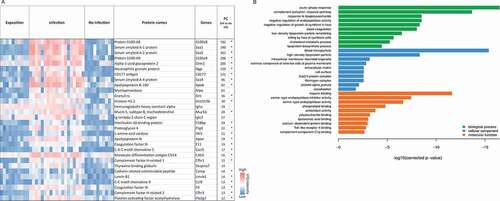
Table 3. Fungal Proteins identified in BAL of mice.
Table 4. Fungal proteins detected in human BAL fluid by LC-MS/MS.