
Figures & data
Figure 1. Comparative inhibitory activity of culture filtrates of WT and siderophore-deficient P. aeruginosa strains on mycelial expansion of A. fumigatus.
AF10 conidia were co-cultured with filtrates of two WT PA strains (PA01 and PA14), three siderophore loss-of-function mutants (PA14 pvdD−, pchE−, and pvdD−pchE−), or RPMI medium (control) in the IncuCyte ZOOM time lapse microscopy system. Four independent experiments with technical triplicates in each run were performed. (a) Representative images of AF mycelia after 16 h of co-culture with RPMI or the studied PA filtrates. Pink overlays indicate mycelial structures recognized by the NT algorithm. Scale: 250 µm. (b) Development of hyphal length and branch points was tracked for a period of 18 hours. Mean results from one representative experiment and intra-assay standard deviations are shown. (c) AUC values (0–18 h) of hyphal length and branch point numbers in wells exposed to filtrates or RPMI (blinded) were normalized to an internal, unblinded medium control. Mean relative AUCs and inter-replicate standard deviations are shown. One-way ANOVA with Tukey’s multiple comparison test was used for significance testing. (d) Relative AUC values (0–18 h) of hyphal length and branch point numbers of AF10 exposed to PA01 and PA14 culture filtrates generated using either regular (solid columns) or iron-supplemented RPMI (cross-hatched columns, 25 µM FeCl3). RPMI either supplemented or not with FeCl3 was used as the respective controls. The two-sided Student’s t-test was applied to each ± FeCl3 pair for significance testing. * p < 0.05, ** p < 0.01, *** p < 0.001.
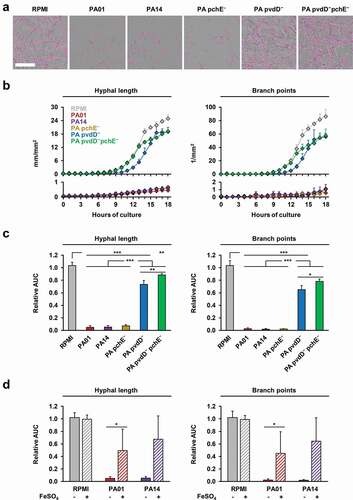
Figure 2. P. aeruginosa products pyoverdine and pyocyanin concentration-dependently inhibit mycelial expansion and branching of A. fumigatus.
(a) AF10 conidia were incubated in RPMI supplemented or not with different concentrations of pyoverdine or pyocyanin and imaged in the IncuCyte ZOOM time-lapse microscopy platform. Mean relative AUC values and standard deviations (technical triplicates) of hyphal length and branch point numbers are shown. One-way ANOVA with Dunnett’s multiple comparison test (versus unsupplemented RPMl) was used for significance testing. * p < 0.05, ** p < 0.01, *** p < 0.001.
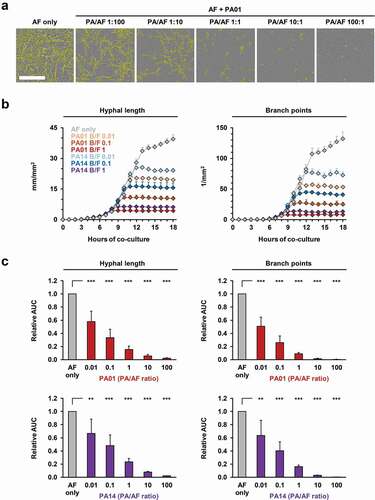
Figure 3. Fluorescence-based NT analysis facilitates efficient longitudinal tracking of inoculum-dependent inhibition of A. fumigatus growth and morphogenesis during co-culture with live P. aeruginosa cells.
Conidia of a GFP-expressing A. fumigatus AF293 strain (200 per well) were incubated in sterile RPMI (“AF only”) or co-cultured with WT PA01 and PA14 cells suspended in RPMI medium. Initial ratios of bacterial versus fungal cells (B/F ratios) ranged from 0.01 (2 PA cells per well) to 100 (2 x 10⁴ PA cells per well). (a) Representative images of AF mycelial morphology after 16 hours of co-culture with PA01 depending on the PA/AF ratio. Yellow overlays indicate mycelial structures recognized by GFP-based NT analysis. Scale: 250 µm. (b) Development of hyphal length and branch points depending on the PA strain and inoculum added. Mean results from one representative plate and intra-assay standard deviations based on technical triplicates are shown. (c) AUC values (0–18 h) of hyphal length and branch point numbers in co-culture wells were normalized to the AF only control. Mean relative AUCs based on 3 independent plates and inter-replicate standard deviations are shown. One-way ANOVA with Dunnett’s multiple comparison test (versus AF only) was used for significance testing. ** p < 0.01, *** p < 0.001.
Supplemental material