Figures & data
Figure 1. Identification of antimicrobial active BAL fractions. A: Illustration of the screening procedure consisting of repeated rounds of peptide separation via chromatography and testing of peptide fractions via radial diffusion assays. B: The BAL library was tested in a radial diffusion assay against B. subtilis (a Gram-positive species) and P. aeruginosa (a Gram-negative species). Peptide fractions 32 to 40 were able to inhibit the growth of both bacteria. The testing of the second peptide library generated from fraction 36 against B. subtilis led to three remaining active peptide fractions 56 to 58. Lung: Design created by kjpargeter – www.freepik.com
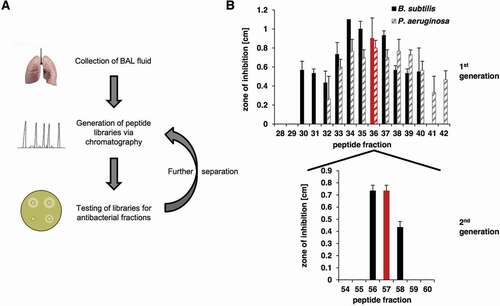
Figure 2. Identification of B2M as antimicrobial active molecule in BAL fluid by mass spectrometry. A (left): Electrospray-mass spectrum of antimicrobial fraction 57 showing multiple charged states for B2M. Right: Mass isotope pattern of antimicrobial fraction Fr57 at z = 11. B (left): Theoretical multiply-charged ions spectrum of mature B2M (UniprotKB-P61769, 21–119). Right: Theoretical mass isotope pattern of B2M (UniprotKB-P61769, 21–119) at z = 11. Both, the mass/charge state distributions and isotope pattern (z = 11) of fraction 57 (Figure 2(a)) match the respective simulated ones of mature B2M (Figure 2(b)). The calculated average masses are very close: 11,729.41 Da (experimental) vs. 11,729.15 Da (theoretical, from ProtParam). C: MS/MS fragmentation spectrum of a B2M proteolytic fragment, corresponding to the sequence IEKVEHSDLSFSK. D: Sequence coverage (93%) by sequencing of digested B2M. Delimited blue horizontal bars represent every proteolytic fragment identified in the sequence. Vertical red bars/squares represent a Cys residue identified as carbamidomethylated. Numbers at both sides of the figure represent the residue position in the precursor sequence. The sequence delimited by arrows represents the signal peptide (UniprotKB-P61769, 1–20)
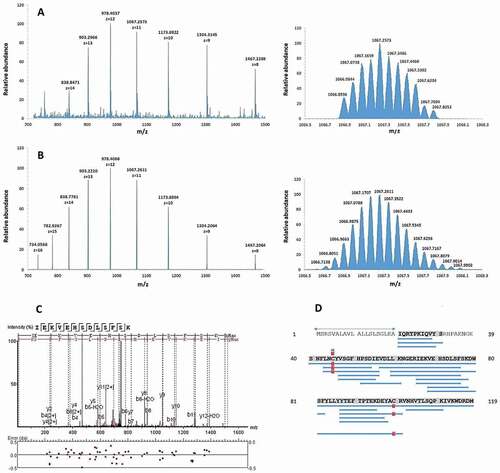
Figure 3. Antibacterial activity of purified B2M. The dose-dependent antibacterial activity of B2M was tested in a radial diffusion assay against the screening strains B. subtilis and P. aeruginosa (a), and against L. monocytogenes (b). The mean value and standard deviation for three independent experiments is depicted
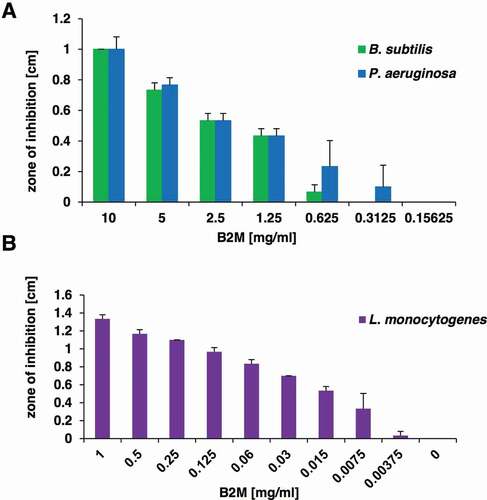
Table 1. Radial diffusion assay of B2M fibril formulations. B2M (1 mg/ml) was incubated for 30 min at 37°C in 150 µl of assay buffer of pH 4.5 or pH 7 allowing for fibril formation. After centrifugation, the supernatant was collected and the resulting fibril pellet was dissolved in 150 µl of assay buffer of pH 4.5 or pH 7. Depicted are the mean ± standard deviation of the zone of inhibition [cm] in a radial diffusion assay against L. monocytogenes.
Figure 4. pH-dependent antibacterial activity of purified B2M against L. monocytogenes. A: Amyloidogenic potential of B2M at low pH conditions. The presence of amyloid fibrils was monitored by ThT staining. B2M was either subjected directly to ThT measurement or was incubated at 37°C for 30 min in buffer with the indicated pH. EF-C fibrils served as positive control (pos control). The mean value and standard deviation for two independent experiments is depicted. B: Antibacterial activity of B2M was tested in radial diffusion assays using pH modified agarose solutions (4.5 to 7). Antibacterial activity of B2M in radial diffusion assays could only be observed at pH values lower than 6. C: The pH-dependent effect of B2M (1 mg/ml) against L. monocytogenes in a survival assay. Peptide and mock-treated bacteria were incubated at pH values 7, 5.5 and 4.5 for 30, 60 and 120 min. Quantification of living bacteria was performed by CFU determination and the values are expressed as % survival compared to mock-treated samples. The mean value ± standard deviation is depicted for three independent experiments
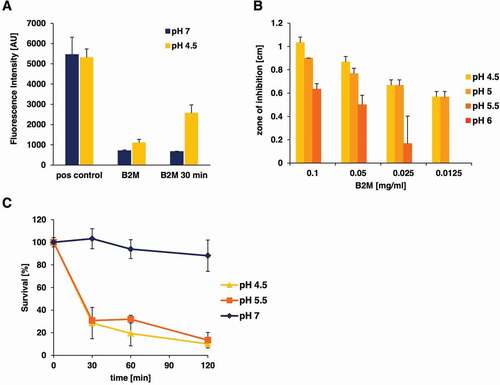
Figure 5. TEM pictures of L. monocytogenes. Bacterial cells were either mock-treated with H2O (a) or treated with 1 mg/ml B2M for 15 min (b) followed by fixation. Ultra-thin sections (80 nm) were imaged in a Zeiss TEM 109 or in a Jeol TEM 1400. Scale bars are 5 µm for upper left, 2 µm for upper right, 1 µm for lower left and 500 nm for lower right pictures
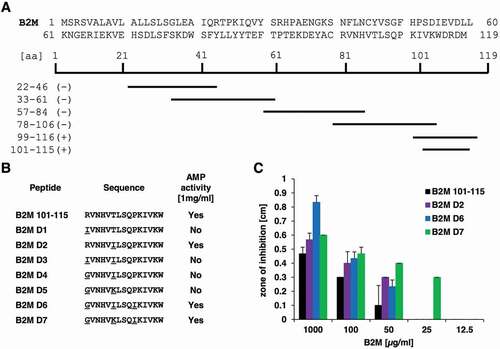
Figure 6. Overview of B2M derivatives and their AMP activity. A: Sequence of full-length B2M and the truncated peptides experimentally tested for their antimicrobial activity. Peptides marked with a minus (-) showed no activity against P. aeruginosa at a concentration of 1 mg/ml, whereas the fragments located in the C-terminal part of B2M highlighted with a plus (+) were able to inhibit growth of the bacterium in a radial diffusion assay. B: Derivatives of the C-terminal part of B2M encompassing amino acids 101 to 115 and their activity against P. aeruginosa. All active peptides were tested in triplicates. C: Dose-dependent activity of the B2M derivatives tested in a radial diffusion assay. Depicted is the mean ± standard deviation of three independent assays