Figures & data
Table 1. Primers used for cloning and quantitative real-time PCR
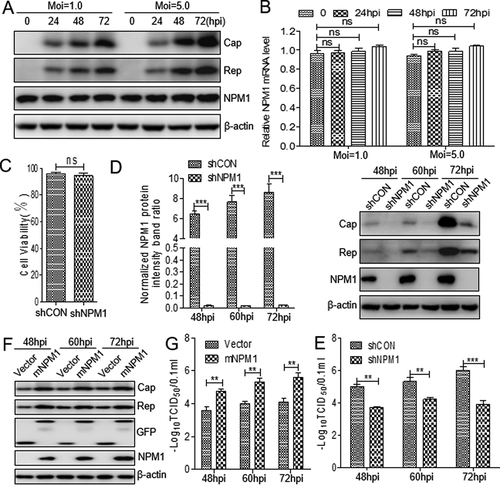
Figure 1. Nucleolar phosphoprotein nucleophosmin-1 (NPM1) expression sustained porcine circovirus type 2 (PCV2) replication. A. PK-15 cells were infected with PCV2 at an MOI of 1.0 or 5.0 for 0, 24, 48, and 72 h, and whole cell lysates were collected, and then analyzed by immunoblotting with rabbit anti-NPM1, mouse anti-capsid protein (Cap), mouse anti-replicase (Rep), and mouse anti-β-actin monoclonal antibodies (mAbs). B. Real-time quantitative PCR measurements of the NPM1 mRNA abundance at the indicated times and MOIs described in panel A. Expression was normalized to the GAPDH mRNA level. C. The viability of PK-15 cells stably expressing a short hairpin RNA (shNPM1) was analyzed with a cell counting kit-8 assay. D. NPM1-silenced cells were infected with PCV2 at an MOI of 1.0 for 48, 60, and 72 h. The cell lysates were analyzed by immunoblotting to examine protein levels of Cap, Rep, NPM1 and β-actin. shCON-transfected cells were used as negative controls. E. The samples from D were used to measure PCV2 replication by determining TCID50 values. F. NPM1-silenced PK-15 cells were transfected with empty vector or GFP-mNPM1 for 24 h, respectively, and then infected with PCV2 at an MOI of 1.0 for 48, 60, and 72 h. The protein levels of Cap, Rep, NPM1 and β-actin were then determined by western blotting with the corresponding antibodies. G. The samples from F were used to measure PCV2 replication by determining TCID50 values. β-actin was used as a loading control. The NPM1 protein band intensity was analyzed using ImageJ software. Data are presented as means ± SD of three independent biological experiments. ns, not significant; **P < 0.01; ***P < 0.001

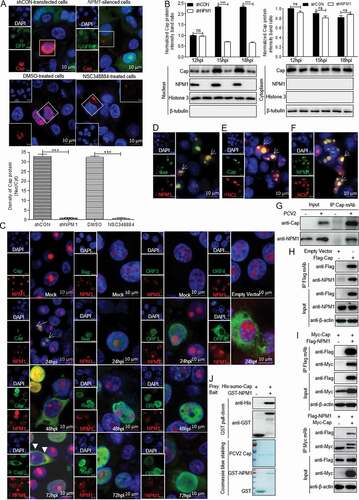
Figure 2. Direct interaction between NPM1 and Cap. A. NPM1-knocked down and shCON-transfected or 0.5 μM NSC348884- and DMSO-treated PK-15 cells were inoculated with PCV2 at an MOI of 25.0 for 15 h. Confocal microscopy analysis was performed with anti-Cap mAb as the primary antibody and Alexa Fluor 546-conjugated donkey anti-mouse antibody as the secondary antibody. GFP signals indicate silenced PK-15 cells. B. NPM1-knocked down PK-15 cells were infected with PCV2 at an MOI of 25.0 for 12, 15, and 18 h. shCON-transfected PK-15 cells were used as controls. The levels of Cap and NPM1 protein in the nucleus and cytoplasm were detected by immunoblotting with anti-Cap, anti-NPM1, anti-histone H3 (nuclear marker), and anti-β-tubulin (cytoplasmic marker) antibodies. The Cap and NPM1 protein band intensities or the intensities of nuclear/cytoplasmic resident viral protein Cap in the PCV2-infected shCON and shNPM1 or DMSO- and NSC348884-treated cells were analyzed using ImageJ software. Data are presented as means ± SD of three independent biological experiments. ns, not significant; ***P < 0.001. C. The colocalization of viral proteins Cap, Rep, ORF3, and ORF4 with NPM1. PK-15 cells were infected with PCV2 at an MOI of 1.0 for 24, 48, and 72 h or transfected with Myc-ORF4 for 24 h. The cells were fixed and stained with mouse mAbs against Cap, Rep, ORF3, and ORF4, rabbit anti-NPM1 antibody, FITC-labeled goat anti-mouse IgG, and Alexa Fluor 546-conjugated donkey anti-rabbit IgG. D. NPM1 colocalization with PCV2 Cap in transfected cells. HEK293T cells were cotransfected with GFP-Cap and mCherry-NPM1 for 24 h, and cells were fixed and then subjected to confocal observation. E and F. Nucleolin colocalization with Cap or NPM1 in transfected cells. HEK293T cells were cotransfected with mCherry-NCL and GFP-Cap (E) or GFP-NPM1 (F) for 24 h, and cells were fixed and then subjected to confocal observation. Nuclei were stained with 4ʹ, 6ʹ-diamidino-2-phenylindole (DAPI) (A, C-F). Scale bar, 10 μm. G. PK-15 cells were infected with PCV2 at an MOI of 1.0 for 48 h and cell lysates were immunoprecipitated with purified anti-Cap IgG mAb, followed by immunoblotting using corresponding antibodies. H. PK-15 cells were transfected with empty vector, and FLAG-Cap for 48 h. I. HEK293T cells were cotransfected with Myc-Cap and FLAG-NPM1 for 48h. The cell lysates were immunoprecipitated with FLAG beads (H, I) or anti-Myc purified IgG (I). J. Purified His-sumo-Cap separately mixed with the GST, GST-NPM1 proteins were pulled down with glutathione S-transferase (GST) beads, and then subjected to GST pull-down assays and immunoblotted with corresponding antibodies

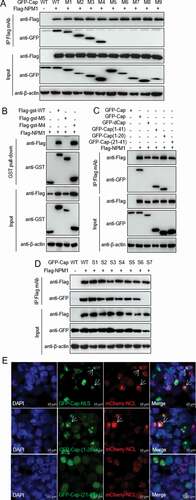
Figure 3. Identification of Cap binding domain to NPM1. A and B. The N-terminal nuclear localization signal of PCV2 Cap interacted with NPM1. HEK293T cells were cotransfected with plasmids encoding full-length PCV2 Cap or truncation mutants fused with a GFP-, or FLAG-GST tag, along with FLAG-NPM1; cell lysates were subjected to immunoprecipitation or GST pull-down and immunoblotting using the indicated antibodies. C. The Cap N-terminal amino acid residues 1 to 20 interacted with NPM1. HEK293T cells were cotransfected with plasmids GFP-Cap, GFP-dCap, GFP-Cap(1-41), GFP-Cap(1-20) and GFP-Cap(21-41), along with FLAG-NPM1. Cell lysates were immunoprecipitated with FLAG beads, followed by immunoblotting using the indicated antibodies. D. Identification of N-terminal arginine-rich motif of Cap responsible for the interaction between Cap and NPM1. HEK293T cells were cotransfected with Cap or Cap-S1, -S2, -S3, -S4, -S5, -S6, -S7 expression vectors, along with FLAG-NPM1, and the cell lysates were subjected to immunoprecipitation and immunoblotting using the indicated antibodies. E. Identification of the nucleolar localization signal in Cap. HEK293T cells were cotransfected with mCherry-NCL and GFP-Cap(1-41), GFP-Cap(1-20) or GFP-Cap(21-41) for 24 h. Then, the resultant cells were fixed, stained with DAPI and subjected to confocal observation. Scale bar, 10 μm

Figure 4. Unphosphorylated Serine 48 of NPM1 binds to Cap, regulating PCV2 replication. A. Schematic representation of the OligoD, HistonD, and nucleic acid-binding (NBD) domains of NPM1 and their truncation mutants used in this study. B. The OligoD domain of NPM1 (amino acids [aa] 1 to 117) interacted with PCV2 Cap. HEK293T cells were cotransfected with plasmid GFP-NPM1-WT or serial GFP-NPM1 truncated mutants M1 to M6, along with FLAG-Cap. The cell lysates were immunoprecipitated with FLAG beads and immunoblotted using the indicated antibodies. C. The N-terminal amino acid sequence of the OligoD domain of NPM1. Serine (S) or threonine (T) residues are marked in red. D and E. Mapping the crucial amino acids of OligoD responsible for binding to PCV2 Cap. HEK293T cells were cotransfected with NPM1 or NPM1 variants (-S48A, -S48E, -S88A, -S88E, -T95A, or -T95D), along with FLAG-Cap and FLAG-GST-Cap expression vectors, and the cell lysates were subjected to immunoprecipitation or GST pull-down and immunoblotting using the indicated antibodies. F. NPM1-silenced PK-15 cells were transfected with the indicated mNPM1 plasmids for 24 h and were infected with PCV2 at an MOI of 1.0 for 48, 60, and 72 h. Viral titers were then determined by TCID50. Data are presented as means ± SD of three independent biological experiments. ns, not significant; **P < 0.01. G. Alignment of amino acid residue Ser48 in NPM1 from different genera. H. Prediction of binding pattern of N-terminus of OligoD domain from NPM1 with N-terminal residues 1 to 20 of PCV2 Cap using PyMOL software
![Figure 4. Unphosphorylated Serine 48 of NPM1 binds to Cap, regulating PCV2 replication. A. Schematic representation of the OligoD, HistonD, and nucleic acid-binding (NBD) domains of NPM1 and their truncation mutants used in this study. B. The OligoD domain of NPM1 (amino acids [aa] 1 to 117) interacted with PCV2 Cap. HEK293T cells were cotransfected with plasmid GFP-NPM1-WT or serial GFP-NPM1 truncated mutants M1 to M6, along with FLAG-Cap. The cell lysates were immunoprecipitated with FLAG beads and immunoblotted using the indicated antibodies. C. The N-terminal amino acid sequence of the OligoD domain of NPM1. Serine (S) or threonine (T) residues are marked in red. D and E. Mapping the crucial amino acids of OligoD responsible for binding to PCV2 Cap. HEK293T cells were cotransfected with NPM1 or NPM1 variants (-S48A, -S48E, -S88A, -S88E, -T95A, or -T95D), along with FLAG-Cap and FLAG-GST-Cap expression vectors, and the cell lysates were subjected to immunoprecipitation or GST pull-down and immunoblotting using the indicated antibodies. F. NPM1-silenced PK-15 cells were transfected with the indicated mNPM1 plasmids for 24 h and were infected with PCV2 at an MOI of 1.0 for 48, 60, and 72 h. Viral titers were then determined by TCID50. Data are presented as means ± SD of three independent biological experiments. ns, not significant; **P < 0.01. G. Alignment of amino acid residue Ser48 in NPM1 from different genera. H. Prediction of binding pattern of N-terminus of OligoD domain from NPM1 with N-terminal residues 1 to 20 of PCV2 Cap using PyMOL software](/cms/asset/c4663e45-dddb-45d0-b1cd-c86ecc760b3d/kvir_a_1832366_f0004_oc.jpg)
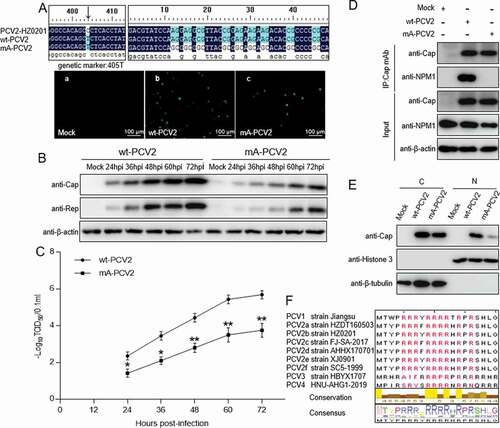
Figure 5. Rescue of PCV2 with arginine to alanine substitution in the nucleolar localization signal. A. wt-PCV2 and mA-PCV2 with residues Arg-5, −6, −7, −9, −10, −11, −12, −14 and −16 being replaced by alanines were rescued on PK-15 cell monolayers and rescue of wt-PCV2 and mA-PCV2 were validated by anti-Cap immunofluorescence assays and Sanger sequencing. (a) Mock-infected cells; (b) wt-PCV2-infected cells; (c) mA-PCV2-infected cells. Scale bar, 100 μm. B. Western blotting of viral proteins from wt-PCV2 and mA-PCV2. PK-15 cells were infected with wt-PCV2 or mA-PCV2 at an MOI of 1.0 and cultured for the indicated times. Cell lysates were subjected to western blotting with the indicated antibodies. β-actin was used as a loading control. C. One-step growth curves of wt-PCV2 and mA-PCV2. TCID50 was detected in wt-PCV2- or mA-PCV2-infected samples from panel B. Data are presented as means ± SD of three independent biological experiments. *P < 0.05; **P < 0.01. D. The Cap protein of mA-PCV2 lost the ability to bind to NPM1 in infected cells. PK-15 cells were infected with wt-PCV2 at an MOI of 1.0 or mA-PCV2 at an MOI of 5.0 for 48 h. Mock infected cells was used as controls. E. The levels of PCV2 Cap protein in the cytoplasm and nucleus of wt-PCV2- and mA-PCV2-infected cells. PK-15 cells were mock infected or infected with wt-PCV2 and mA-PCV2 at an MOI of 25.0 for 15 h, and the viral protein Cap levels in the cytoplasm and nucleus were separated using a nuclear and cytoplasmic extraction kit, and were detected by immunoblotting with anti-Cap, anti-histone H3 (nuclear marker), and anti-β-tubulin (cytoplasmic marker) antibodies. Data are presented as means ± SD of three independent biological experiments. C, cytoplasmic extracts; N, nuclear extracts. ***P < 0.001. F. Amino acid sequence alignment of the arginine-rich motifs from different PCV genotypes. Arginine residues are marked in red

