Figures & data
Figure 1. Impact of the HBP incubation time on C. albicans germination. A: C. albicans WT DSM1386 yeast-to-hyphal transition and germ tube formation in human blood plasma (HBP) in vitro at 37°C and 1000 rpm. The mean germ tube lengths of C. albicans cells incubated in PBS or HBP were measured. Thirty C. albicans cells were observed per time point and condition B-D: Representative micrographs of a yeast cell incubated in PBS for 60 min (b), a 30-min germinated cell (c), and a 60-min germinated cell (d). E: Hyphae formation after 180 min incubation in HBP
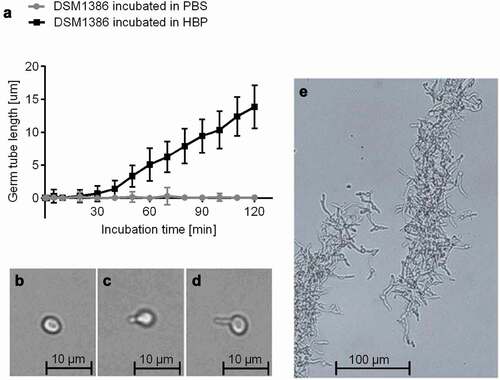
Figure 2. Maximum adhesion forces of C. albicans yeast cells to naïve CVC surfaces from different manufactures. Individual yeast cells incubated for 30 min in PBS were immobilized on FluidFM micropipettes and used for SCFS on naïve CVC surfaces from three different manufacturers (I to III). A: Representative retraction curves collected from cells that were probed with CVC surfaces from manufacturers I to III without any surface delay (0 s). B: Mean adhesion forces obtained from force/distance curves recorded on CVC surfaces from manufacturers I to III with a surface delay time of 0 s. Data are shown as a box and whisker plot (min-to-max) representing the mean values of 10 individual cells per CVC type. ns, not significant (Kruskal-Wallis test with Dunn’s post hoc test). C: Influence of the surface delay time on the adhesion forces. Yeast cells were probed with the CVC surface with different contact times (0 s and 1 s). Data are shown as a box and whisker plot (min-to-max) representing the mean values of 10 individual cells per time point and condition. ns, not significant; **, P< 0.01 (Mann-Whiney U test)
Table 1. Adhesion forces and rupture lengths of yeast cells, 30-min and 60-min germinated cells on untreated and HBP coated CVC surfaces
Figure 3. Impact of germination on the adhesion forces of C. albicans cells to naïve and HBP-coated CVC surfaces. Cells were either incubated in PBS (yeast cells) or HBP (30-min and 60-min germinated cells). Individual cells were immobilized on FluidFM micropipettes and used for SCFS on naïve or HBP-coated tubing of CVC type I (surface delay time 0 s). A, B: Representative retraction curves obtained with the cell types indicated on untreated (a) or HBP-coated (b) CVC surfaces. C, D: Maximum adhesion forces (c) and rupture lengths (d) on naïve (white boxes) or HBP-coated (gray boxes) CVC surfaces. Data are shown as box and whisker plots (min-to-max) representing the mean values obtained from ≥10 individual cells per condition. *, P< 0.05; **, P< 0.01 (Mann Whitney U test)
Figure 4. Impact of germination on floating and adhesion behaviors of C. albicans cells. 30-min and 60-min germinated cells were channeled through Tecoflex® EG 85A-functionalized and HBP-coated ibidi Sticky-Slide chambers with a flow rate of 4 dyn/cm2. A: Adhesion kinetics of yeast cells, 30-min and 60-min germinated cells on HBP-coated Tecoflex® EG 85A after 30 min in flow. Data are shown as box and whisker plots (min-to-max) representing counts of adherent cells/mm2/min. **, P< 0.01 (Mann Whitney U test). B: Representative images of 30-min germinated cells (top left image), 60-min germinated cells (bottom left image) and floating 60-min germinated cells as triplets (right image; sessile cells are out of optical focus and surrounded by a halo). C, D: Germ tube angles of floating (blue symbols) and attached (red symbols) germinated cells of WT DSM1386 relative to the flow direction. Percentages of angle frequencies are displayed as polar plots for 30-min germinated cells (c), and 60-min-germinated cells (d). For every condition, a minimum of 100 and 70 germ tube angles were measured for adherent and floating cells, respectively
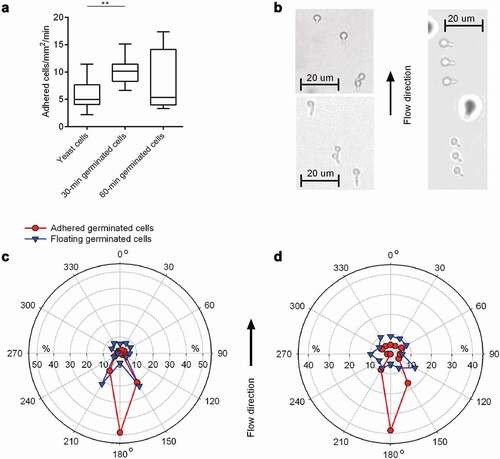
Figure 5. Influence of Als3 on C. albicans adhesion to HBP-coated CVC surfaces. Cells were incubated in HBP for 30 min or kept in PBS. Individual cells were immobilized on FluidFM micropipettes and used for SCFS on HBP-coated tubing of CVC type I (surface delay time 0 s). A, B: Maximum adhesion forces (a) and rupture lengths (b) of C. albicans BWP17 and its als3Δ/als3Δ mutant CAYF178U. Data are shown as box and whisker plots (min-to-max) representing the mean values obtained from 9 individual cells per condition (**, P< 0.01 Mann-Whitney U test)
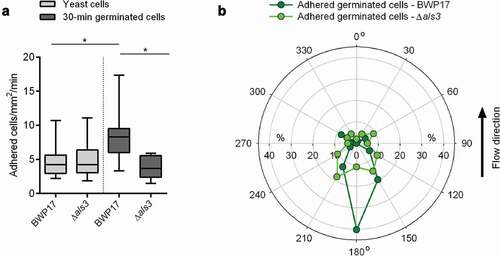
Figure 6. Impact of Als3 on adhesion and germ tube orientation of C. albicans cells adhered in flow. 30-min germinated cells were channeled through a flow chamber with a flow rate of 4 dyn/cm2. A: Adhesion kinetics of C. albicans BWP17 and its als3Δ/als3Δ mutant (als3Δ) after 30 min. Data are shown as box and whisker plots (min-to-max) representing counts of adherent cells/mm2/min. *, P< 0.05 (Mann Whitney U test). B: Germ tube angles of attached 30-min germinated cells of BWP17 (dark green symbols) and its als3Δ/als3Δ mutant (light green symbols) relative to the flow direction. Percentages of angle frequencies are displayed as polar plot, based on a minimum of 90 germ tube angles per condition