Figures & data
Figure 1. Recognition and transcriptional profiles of ENA and NK ATPases in B. bassiana. (a) Phylogenetic relationships of ENA1a-c, ENA2a/b and NK1/2 revealed by cluster analysis and their functional domains predicted at https://www.ncbi.nlm.nih.gov/Structure/. The bootstrap values of 1000 replications are given at nodes. Scale: branch length proportional to genetic distance assessed with a neighbor-joining method in MEGA7 at http://www.megasoftware. net/. (b) Relative transcript levels of five ENA and two NK genes in the 3-day-old cultures of a wild-type strain (WT) grown at 25°C in CDB, which was adjusted to pH 6.0, 7.0, 8.0 and 9.0 respectively or supplemented with 0.7 M of NaCl or KCl and adjusted to pH 7.0, and calculated with respect to the standard at pH 7.0. Error bars: SD of the mean from three cDNA samples assessed by qPCR analysis with paired primers (Table S2)
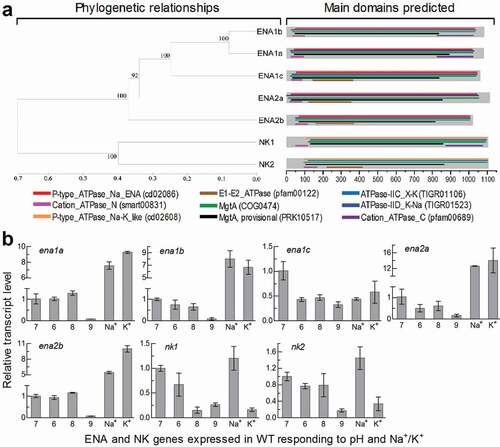
Figure 2. Roles of ENA and NK genes in homeostatic processes of cellular H+ in B. bassiana. (a) Extracellular pH (H+) levels quantified from the submerged cultures of single-gene deletion mutants (DM), complemented mutants (CM) and WT during a 5-day incubation at 25°C in CDB at initial pH 7.5 (unadjusted). ***P < 0.001 between DM and WT or CM. (b) Vacuolar pH (H+) levels quantified from fluorescent dye-stained hyphae at the excitation/emission wavelengths of 450/535 and 490/535 nm under a confocal microscope. The examined hyphae were collected from 3-day-old CDB cultures. Means marked with different lowercase letters differ significantly (Tukey’s HSD, P < 0.05). Error bars: SD of the mean from three replicates of independent cultures (a) or of 15 vacuoles (b). (c) LSCM images (scale bars: 10 μm) for subcellular localization of GFP-tagged ENA1a and ENA2b fusion proteins (shown in green) in the WT hyphae collected from 24-h- and 72-h-old SDBY cultures and stained with FM4-64 (shown in red). Panels 1–4 are bright, expressed, stained and merged views of the same microscopic field. Note that both ENA1a::GFP and ENA2b::GFP molecules accumulate heavily in the vacuoles
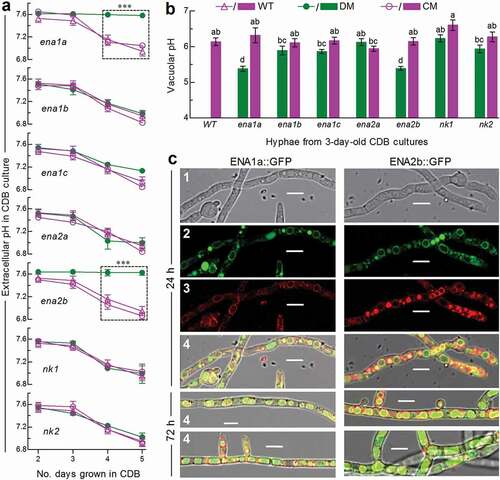
Figure 3. Roles of ENA and NK genes in homeostatic processes of cellular Na+ and K+ in B. bassiana. Cytosolic Na+ (upper panel) and K+ (lower panel) levels are presented as ratios of fluorescence intensities (FI), which were quantified at the alternating excitation wavelengths of 340/380 nm from the cells incubated at 25°C for 30 min in CDB at indicated pH levels and stained with 10 μM of Na+- and K+-specific fluorescent probes (SBFI-AM and PBFI-AM) respectively. The asterisked means of deletion mutants differ significantly from those of corresponding control strains not marked (Tukey’s HSD, P < 0.05). Error bars: SD of the mean from three replicates of independent cultures
Figure 4. Essential roles of ena1a and ena2b in B. bassiana responses to multiple stresses during a 7-day growth at 25°C in a light/dark cycle of 12:12 h. (a) Images (scale bar: 10 mm) for 7-day-old colonies of single-gene deletion mutants (DM), complemented mutants (CM) and WT co-cultivated with or without chemical stressors in CDA. (b–d) Relative growth inhibition (RGI) percentages of fungal colonies on pH-unadjusted CDA plates supplemented with indicated concentrations of NaCl, KCl, H2O2, MND (menadione), CGR (Congo red), CFW (calcofluor white), SBT (sorbitol), and five metal cations respectively. (e) RGI values of fungal colonies on CDA with initial pH adjusted to 5.0, 7.0 and 9.0 after 0.4 M NaCl, 0.4 M KCl or 10 mM LiCl was added for response to a combination of each cation with pH change. Each colony was initiated by spotting 1 μl of a 106conidia/ml suspension. RGI values were computed with respect to a control free of any stress cue in the pH-unadjusted CDA (b–d) or the CDA at pH 7.0 (e). Asterisked means in each bar group differ significantly from those not marked (Tukey’s HSD, P < 0.05). Error bars: SD of the mean from three replicates
Figure 5. Requirements of ena1a and ena2b for pathogenicity and virulence of B. bassiana. (a, b) Survival trends of G. mellonella larvae after topical application (immersion) of a 107 conidia/ml suspension for normal cuticle infection and hemocoel injection of ~500 conidia per larva for cuticle-bypassing infection respectively. (c) LT50 values estimated for deletion mutants (DM), complemented mutants (CM) and WT against the larvae through probit analyses of time-mortality trends derived from (a), (b) and Supplementary Fig. S8. Note that LT50s are unavailable for Δena1a and Δena2b (arrowed) through the normal infection, much prolonged for both mutants (asterisked, P < 0.001 for Tukey’s HSD test) through the cuticle-bypassing infection, but similar for all other deletion mutants and control strains in either infection mode. Error bars: SD of the mean from three replicates
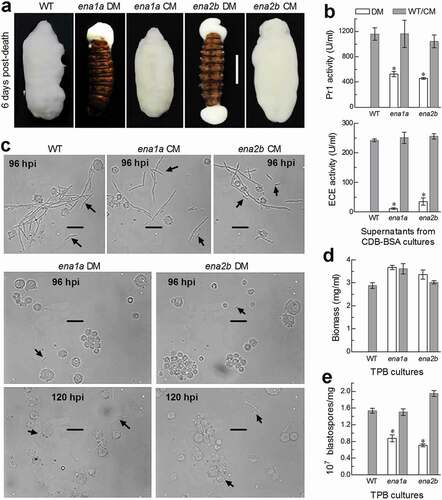
Figure 6. Important roles of ena1a and ena2b in cellular events critical for pathogenicity and virulence of B. bassiana. (a) Images (scale: 10 mm) of fungal outgrowths on G. mellonella larvae 6 days after death from mummification by deletion mutants (DM), complemented mutants (CM) and WT through intrahaemocoel injection. Note that two deletion mutants grew out only from insect mouth and/or anus but failed to directly penetrate through the cadaver cuticle for outgrowth. (b) Total activities of cuticle-degrading extracellular enzymes (ECE) and Pr1 proteases quantified from the supernatants of 3-day-old CDB-BSA cultures, which were initiated with 50 ml aliquots of a 106 conidia/ml suspension at 25°C. (c) Microscopic images (scale: 20 μm) of hyphal bodies (arrowed) formed in the hemolymph of larvae surviving 96 or 120 h post-injection (hpi). Spherical or subspherical cells are host hemocytes. (d, e) Biomass levels and dimorphic transition rates (no. blastospores/mg biomass) measured from the 3-day-old cultures of a 106 conidia/ml TPB mimicking insect hemolymph. Asterisked means are significantly different from those unmarked in each graph (Tukey’s HSD, P < 0.01). Error bars: SD of the mean from three replicates