Figures & data
Table 1. Effect of aprepitant on the antifungal activity of fluconazole (FLC), voriconazole (VRC), and itraconazole (ITC) against C. auris clinical isolates
Figure 1. Time-kill assay of aprepitant (APR) at 10 µg/ml, itraconazole (ITC) at 1 µg/ml, or a combination of both agents at the same concentration as tested alone. Test agents were evaluated against C. auris AR0390 over a 48-hour incubation period at 35 °C. Cells treated with DMSO (1%) served as a negative untreated control. Error bars represent standard deviation values
Figure 2. The anti-biofilm activity of aprepitant (APR)/itraconazole (ITC) against C. auris. (a) The inhibitory effect of the aprepitant (10 µg/mL)/itraconazole (1 µg/mL) combination on the formation of C. auris AR0390 biofilms as determined by the XTT reduction assay. (b) The ability of the aprepitant/itraconazole combination to diminish the metabolic activity of mature C. auris AR0390 biofilms. Data are shown as means ± SD. * indicates a statistical significance (P < 0.05) relative to the untreated control (P < 0.05), whereas #, indicates a statistical significance (P < 0.05) relative to the treatment with either aprepitant or itraconazole alone. Statistical significance was assessed by one-way ANOVA using Dunnett’s test for multiple comparisons
Figure 3. Interaction between aprepitant and itraconazole against different Candida species. (a) ƩFICI (fractional inhibitory concentration index) values were calculated from checkerboard assays. Cultures of C. albicans TWO7243, C. krusei ATCC 14243, C. tropicalis ATCC 1369, and C. parapsilosis ATCC 22019 were treated with APR (10 µg/ml) and ITC (0.25 × MIC), either alone or in combination. Treated cultures were incubated at 35°C for 24 h before being spotted onto YPD agar plates and reincubated for an additional 24 h. Plates were then scanned (b) and CFU count was performed (c)
Table 2. List of differentially expressed genes (DEGs) for C. auris AR0390 treated with a combination of aprepitant (10 µg/ml) and itraconazole (1 µg/ml)
Figure 4. Transcriptional comparison of C. auris AR0390 treated with aprepitant (APR), itraconazole (ITC), or a combination of both versus the untreated control. (a) Heat map of FPKM values of DEGs of each treatment versus the untreated control, scaled by row. (b) Volcano blot of DEGs from C. auris AR0390 treated with aprepitant/itraconazole (APR/ITC) at 10/1 µg/ml. (c) Volcano blot of DEGs from C. auris AR0390 treated with aprepitant (APR) at 10 µg/ml. (d) Volcano blot of DEGs from C. auris AR0390 treated with itraconazole (ITC) at 1 µg/ml. Significant down-regulated DEGs are shown in green, whereas significant up-regulated DEGs are shown in red
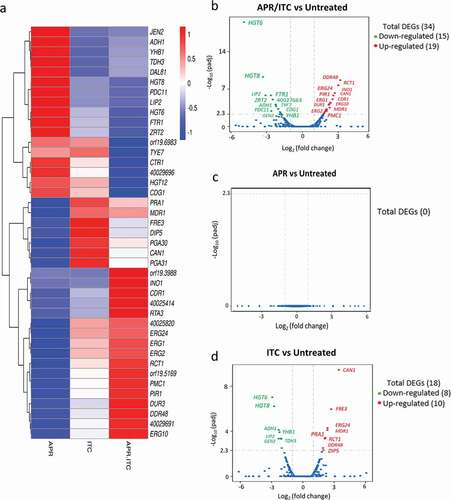
Table 3. List of differentially expressed genes (DEGs) for C. auris AR0390 treated with itraconazole (1 µg/ml)
Figure 5. Enrichment analysis of all GO (gene ontology) terms of DEGs identified from the aprepitant/itraconazole combination (APR/ITC) versus the untreated control. GO analysis of DEGs was implemented by the ClusterProfiler R package and a P-value ≤ 0.05 was used as the cutoff parameter. Panel (a) displays up-regulated GO terms and panel (b) displays down-regulated DEGs
Figure 6. Quantification of C. auris selected genes that were differentially expressed only in the aprepitant/itraconazole combination (APR/ITC). Log phase C. auris AR0390 cells were exposed to APR (10 µg/ml), ITC (1 µg/ml), or a combination of both drugs for three hours. Following treatment, cells were harvested, lysed, and RNA was extracted. Gene expression was determined by quantitative RT-PCR using ACT1 as a housekeeping gene and the untreated sample as a reference control. An absolute two-fold change relative to the untreated control was set as a statistical cutoff value. The result is presented as mean ± SD
Figure 7. Effect of aprepitant/itraconazole on the ROS levels in the presence (+) or absence (-) of iron. Carboxy-H2DCFDA probe was used to analyze ROS levels within C. auris AR0390 in the presence (+) or absence of iron source (FeSO4 50 µM). PBS suspensions of C. auris cells, at 1× 10⁶ CFU/ml, were treated with either aprepitant (APR, 10 µg/ml), itraconazole (ITC, 1 µg/ml), or a combination of both for 3 h, and then were treated with H2DCFDA for 1 h, before measuring the fluorescence intensity as an indication of ROS levels. Data are shown as means ± SD. An asterisk (*) indicates statistical significance (P < 0.05) between treated and untreated groups (P < 0.05), whereas #, indicates statistical significance (P < 0.05) between treatment groups in the presence or absence of iron. Statistical significance was assessed by one-way ANOVA using Dunnett’s test for multiple comparisons
Figure 8. Effect of iron supplementation on the antifungal activity of aprepitant/itraconazole (APR/ITC). (a) Effect of iron supplement (FeSO4, at 50 µM) on the time-kill kinetics of aprepitant (10 µg/ml), itraconazole (1 µg/ml), or a combination of both drugs against C. auris AR0390. (b) Spot assays demonstrated the ability of iron supplementation to reverse the antifungal effect exerted by the aprepitant/itraconazole combination (10/1 µg/ml)
Figure 9. In vivo efficacy of aprepitant/itraconazole in Caenorhabditis elegans infected with C. auris. C. elegans nematodes were infected with 1 × 10⁷ CFU C. auris AR0390 and then treated with aprepitant (APR), at 10 µg/ml, and itraconazole (ITC), at 1 µg/ml, either alone or in combination. Untreated worms served as a negative control. (a) C. auris AR0390 CFU burden/worm 24 h post-treatment. An asterisk (*) indicates statistical significance (P < 0.05) relative to the untreated control, while # indicates statistical significance (P < 0.05) compared to the ITC treatment. Statistical significance was assessed by one-way ANOVA using Dunnett’s test for multiple comparisons. (b) Kaplan-Meier survival curve, assessed by log-rank test for significance, of C. elegans nematodes infected by C. auris AR0390 and treated with APR (10 µg/ml), ITC (1 µg/ml), or a combination of both agents