Figures & data
Figure 1. Schematic representation of the rationale and experimental setup to study S. aureus invading the endothelial barrier. (a) Endothelial cells are normally organized into a barrier with cell-cell junctions that control the passage of immune cells, molecules and pathogens. These cell-cell junctions include tight junctions, adherens junctions and a variety of adhesion molecules, such as ZO-1 and CD31 (PECAM-1). In a healthy condition, the barrier integrity is strictly maintained. However, endothelial cells may show loss of cell-cell junctions and this will lead to wound patches in the endothelial membrane. (b) Confocal fluorescence microscopy images of HUVEC in the barrier or confluent conditions stained with antibodies against ZO-1 (red in the merged image) and CD31 (yellow in the merged image). Blue: DAPI-stained nuclei. The micrographs present the maximum pixel value of the Z-stacks of the endothelial layers. Scale bar: 50 µm. (c) Experimental setup used during this study: two different endothelial conditions, referred to as “barrier” and “confluent”, were used for a 1-h infection with GFP-expressing S. aureus. Extracellular bacteria were removed by a 1-h incubation with lysostaphin. Subsequently, samples were collected at different intervals for time-resolved analysis of the infectious process
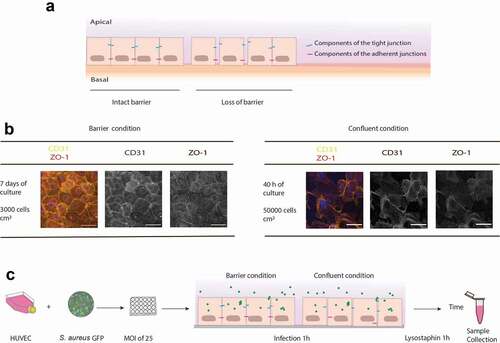
Figure 2. The presence of intact junctions between endothelial cells determines rates of infection and bacterial survival. The progression of infection in the barrier and confluent conditions by GFP-expressing bacteria of S. aureus strains HG001, D32 or D53 was followed by flow cytometry (a and b) and fluorescence microscopy (c). (a) The % of GFP-positive host cells in the total cell population was determined over 48 h for the barrier and 144 h for the confluent condition. (b) The numbers of internalized bacteria per well of a 24-well plate with infected cells were counted over time. Two-way Anova with multiple comparisons was performed to assess the significance of differences in the bacterial numbers for different strains at particular time points of sampling. * (p < 0.03), ** (p < 0.002), *** (p < 0.0002), **** (p < 0.0001). (c) Confocal fluorescence microscopy images of HUVEC cells in barrier and confluent conditions infected with S. aureus (green). The HUVEC were stained at 2 h p.i. with anti-ZO1 (red in merged the image) and anti-CD31 (yellow in merged the image) antibodies. Blue: DAPI-stained nuclei. The micrographs present the maximum pixel value of the Z-stacks of the endothelial layers. Scale bar: 50 µm. For the unmerged images and controls with uninfected cells, see Supplemental Figure S2
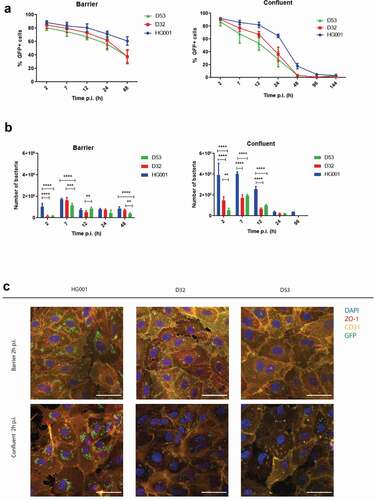
Figure 3. Bacteria internalized by endothelial cells remain localized within membrane-enclosed compartments. Transmission electron microscopy images of HUVEC infected with the S. aureus strains HG001, D32 or D53 in the barrier (a) and confluent (b) conditions. In both conditions, the investigated S. aureus strains show replication from 2 h to 7 h p.i. Electron-dense (e) compartments of different sizes and vacuole-like structures (v) are indicated in the different panels. No cytoplasmic bacteria were detectable in both conditions. Arrows indicate replicating bacteria. Scale bar : 1 µm. For additional images, see Supplemental Figure S3
Figure 4. S. aureus internalized by endothelial cells co-localize with the lysosomal-associated membrane protein 1 (LAMP-1). Confocal fluorescence microscopy images show HUVEC infected with the S. aureus strains HG001, D32 or D53 in the barrier (a) and confluent (b) conditions stained with an anti-LAMP-1 (red) antibody. Blue: DAPI-stained nuclei. Green: GFP-expressing bacteria. Co-localization with LAMP-1 was observed from the beginning of infection (2 h) until the end of the observation time (48 h for the barrier condition and 144 h for the confluent condition) for all three strains. Arrows indicate the co-localization. For enlarged images, see Supplemental Figure S4, and for images recorded at different time points p.i. see Supplemental Figure S5
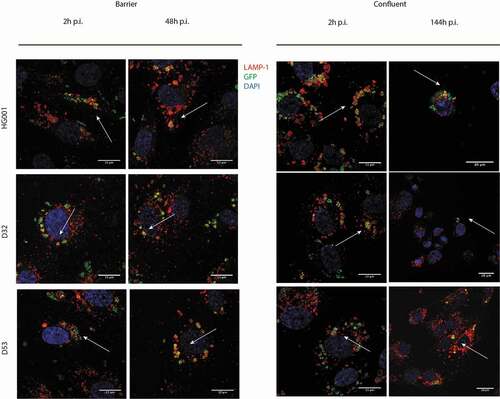
Figure 5. Infection of endothelial cells with S. aureus induces apoptosis. The induction of apoptosis in HUVEC infected with the S. aureus strains HG001, D32 or D53 in the barrier or confluent conditions was inspected by measuring the activity of the apoptotic markers caspases 3 and −7 at different time points p.i. The graphs show the caspase 3/7 induction fold increase over the control with uninfected cells. For additional controls, see Supplemental Figure S6
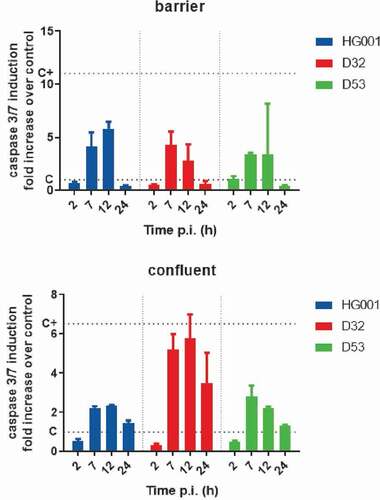
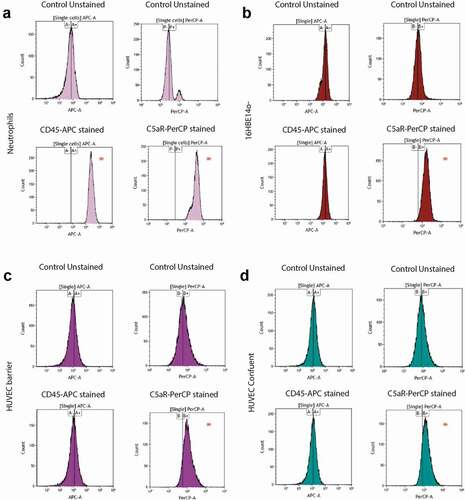
Figure 6. PVL receptor expression in neutrophils, lung epithelial cells and HUVEC. To investigate the expression of receptors for the secreted staphylococcal toxin PVL, a flow cytometry-based cell staining assay was applied using APC-labeled anti-human CD45 and PerCP/Cy5.5-labeled anti-human CD88 (C5aR) antibodies. (a) Human neutrophils (positive control), (b) bronchial epithelial cell line 16HBE14o-, (c) HUVEC in the barrier condition, and (d) HUVEC in the confluent condition. HUVEC and bronchial epithelial cells tested negative for CD45-staining, but showed shifts in fluorescence intensity upon CD88 (C5aR)-staining. Neutrophils showed major shifts in fluorescence intensity upon staining for CD45 and CD88. * indicates the observed shifts in fluorescence intensity upon staining with the anti-CD45 and anti-CD88 antibodies