
Figures & data
Figure 1. Effect of anti-LFA-1 Mab treatment on anti-viral TEFF burst size
Figure 2. Strain-specific effects of anti-LFA-1 Mab treatment on anti-viral TEFF differentiation
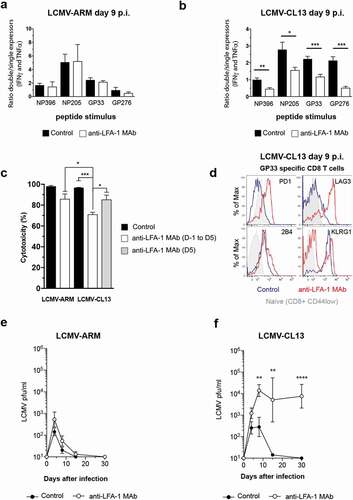
Figure 3. Impact of LFA-1 on CD8 TEFF differentiation and function after LCMV-CL13 infection
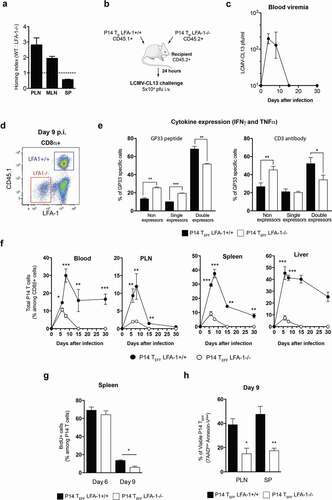
Figure 4. Role of LFA-1 usage and high viremia in TEFF dysfunction after LCMV-CL13 infection (a) 10,000 cells of purified LFA-1+/+ CD45.1+ and LFA-1−/- CD45.2+ P14 TN cells were transferred into the same C57BL/6 CD45.2+ recipients, thus generating P14 chimeric mice. 24 hours later, recipient mice were i.v. challenged with LCMV-CL13 (5x10⁴ or 2 × 10⁶ pfu). The surface expression of CD45.1 and lack of LFA1 expression was used to identify these cells among CD8+ cells in recipient mice. At day 9 p.i. the frequency (b) and (c) the expression of PD-1 and LAG-3 was quantified in P14 TEFF from the blood of infected P14 chimeric mice. Results shown as mean fluorescence intensity (MFI). (d) In parallel, P14 TEFF from the blood of infected mice were restimulated ex vivo with LCMV GP33 peptide to quantify their production of IFNγ and TNFα. Two independent experiments were performed including three mice per group with similar results
Figure 5. Global transcriptomics of TEFF at the peak of anti-viral effector response (a) Genes differentially expressed in GP33-specific TN and TEFF from anti-LFA-1 Mab antibody and control treated mice. Each column represents an individual sample and each row a gene, and cells were colored to indicate relative expression. Top 200 genes upregulated or downregulated in each specific population are shown. (b) Principal Component Analysis of transcriptomic profiles of TN and TEFF. (c) Gene set enrichment analysis was performed between endogenous Dex-GP33 TEFF from anti-LFA-1 Mab treated versus control mice and LFA-1+/+ versus LFA-1−/- P14 TEFF. Overlap of enriched pathways are shown as a Venn diagram. (e,f) At day 9 p.i. splenocytes and blood cells of LCMV-CL13 infected mice were harvested and the binding to Annexin-V and incorporation of 7AAD into TEFF was quantified by flow cytometry. Three independent experiments including three mice per group were performed with similar results
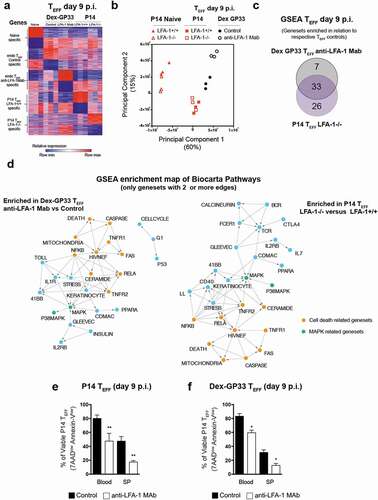
Figure 6. Transcriptional signatures of exhaustion, anergy and deletion tolerance in TEFF in the absence of LFA-1 function. Geneset enrichment analysis (GSEA) on T cells exhaustion [Citation41], anergy [Citation40] and deletion tolerance [Citation39] signatures from MSigDB v7.1 (Broad institute) was performed on day 9 Dex-GP33 (a,c) or P14 TEFF (b,c) from LCMV-Cl13 infected mice. (*) represents signatures with a false discovery rate (FDR) of <0.05
![Figure 6. Transcriptional signatures of exhaustion, anergy and deletion tolerance in TEFF in the absence of LFA-1 function. Geneset enrichment analysis (GSEA) on T cells exhaustion [Citation41], anergy [Citation40] and deletion tolerance [Citation39] signatures from MSigDB v7.1 (Broad institute) was performed on day 9 Dex-GP33 (a,c) or P14 TEFF (b,c) from LCMV-Cl13 infected mice. (*) represents signatures with a false discovery rate (FDR) of <0.05](/cms/asset/d84716f5-062a-4cc1-baff-68d34a93a2d5/kvir_a_1845506_f0006_oc.jpg)