Figures & data
Figure 1. Survival curves of G. mellonella infection with different fungi. (a) G. mellonella larvae were injected with 5 × 10 5 CFUs of C. albicans 1 h post 1 × 10 5 CFUs of C. glabrata infection. (b, c, d) G. mellonella were injected with 1 × 10 5 CFUs of C. glabrata or PBS, after 24 h, the larvae were infected with 5 × 10 5 CFUs of C. albicans (b), 1 × 10 6 CFUs of C. tropicalis (c) or 1 × 10 5 CFUs of C. neoformans (d). Each group contained 11 randomly chosen larvae. Differences were determined by using the log-rank test.* P < 0.05. ** P < 0.01. *** P < 0.001
Figure 2. Survival curves of G. mellonella infection with different fungi post live C. glabrata (LCG) or heat-inactivated C. glabrata (HICG) exposure. G. mellonella were injected with 1 × 10 5 CFUs of LCG, HICG or PBS, 24 h later the larvae were re-injected with 5 × 10 5 CFUs of C. albicans (a), 1 × 10 6 CFUs of C. tropicalis (b), or 1 × 10 5 CFUs of C. neoformans (c). The experiments were repeated 3 times independently. Differences were determined by using the log-rank test. * P < 0.05. ** P < 0.01. *** P < 0.001
Figure 3. Changes of cellular immunity of G. mellonella post live C. glabrata (LCG) or heat-inactivated C. glabrata (HICG) exposure. (a) The number of hemocytes in the cell-free hemolymph after the larvae were exposed with 1 × 10 5 CFUs of LCG or HICG for 24 h. (b) Killing activity of hemocytes against C. albicans, C. tropicalis, or C. neoformans. Larvae were inoculated with 1 × 10 5 CFUs of LCG or HICG for 24 h, and then hemocytes were harvested for assessing the fungicidal activity. The experiments were repeated 3 times independently. Results are shown as mean ± SEM and statistical analysis was performed by One-way ANOVA. * P < 0.05
Figure 4. Proteomics analysis of G. mellonella cell-free hemolymph after exposure of larvae to live C. glabrata (LCG) or heat-inactivated C. glabrata (HICG). (a, b) Left: Unsupervised hierarchical clusters of G. mellonella cell-free hemolymph protein profiles in groups of LCG versus PBS (a), and HICG versus PBS (b). Right: Volcano plots to distinguish the differentially expressed proteins filtered by a fold change of more than 1.3 or less than 0.77 and a maximum P-value of 0.05. (c) Intersection and union of differentially expressed proteins between LCG versus PBS group and HICG versus PBS group
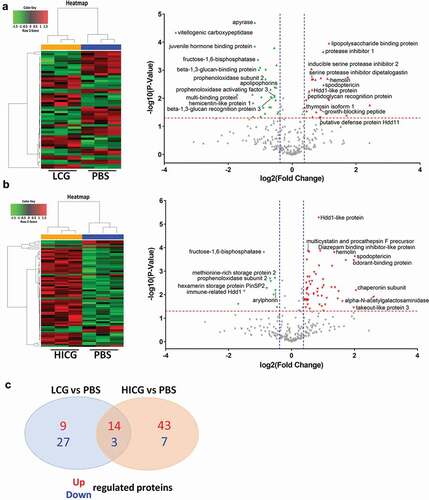
Table 1. Proteins that showed the same expression trend after exposure to live C. glabrata (LCG) or heat-inactivated C. glabrata (HICG) exposure
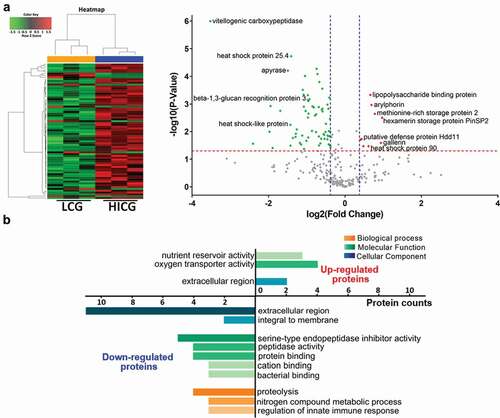
Figure 5. Proteome differences of G. mellonella cell-free hemolymph after live C. glabrata (LCG) or heat-inactivated C. glabrata (HICG) exposure. (a) Left: Unsupervised hierarchical clusters of G. mellonella cell-free hemolymph protein profiles post LCG exposure or HICG exposure. Right: Volcano plots to distinguish the differentially expressed proteins filtered by a fold change of more than 1.3 or less than 0.77 and a maximum P-value of 0.05. (b) Bar chart representing GO terms for biological process, molecular function, and cellular component enriched in the up-regulated and down-regulated proteins of LCG exposure group versus HICG exposure group