Figures & data
Table 1. Patient treatment and timeline of chronic BCG-osis at NIH
Figure 1. Evaluation of mycobacterial Isolates: (a) Difference in colony morphology of Mycobacterium bovis isolates within the BCG vaccinated patient with IFNγR1 deficiency compared to the vaccine Mycobacterium bovis BCG isolate. Colonies of the BCG strains at 3 weeks growth in Middlebrook 7H11 plate (100× magnification, Bar = 0.5 inch). (b) Quantification of colony-forming units (CFUs); from the lysate of peripheral mononuclear cells at d 2 of infection by the 3 strains. Data, mean ± SE (n = 6, **p < 0.01; *p < 0.05; two-tailed paired Student’s t-test). (c) Monocyte-derived macrophages were infected with GFP-transfected strain; at MOI of 2 for 2 d. Slides were made with DAPI staining for nucleic acid content. Representative infected cell of each strain, with also gray color as visible light showing bacteria inside of the limits of the cell (bar = 5 μm), with field showing more cells on smaller scale (bar = 100 μm). (d) Core genome phylogenetic analysis of 14 genomes; 3 BCG strains (BCG-vaccine, BCG-brain, and BCG-lung), 5 representative genomes of M. tuberculosis (H37Rv, CDC1551, F11, KZN 1435, and KZN 4207), and 6 M. bovis isolates (BAA_935, Tokyo 172, BCG1 Russia, BCG Pasteur 1173P2, BCG Danish 1331 Belgium, and BCG Denmark)
![Figure 1. Evaluation of mycobacterial Isolates: (a) Difference in colony morphology of Mycobacterium bovis isolates within the BCG vaccinated patient with IFNγR1 deficiency compared to the vaccine Mycobacterium bovis BCG isolate. Colonies of the BCG strains at 3 weeks growth in Middlebrook 7H11 plate (100× magnification, Bar = 0.5 inch). (b) Quantification of colony-forming units (CFUs); from the lysate of peripheral mononuclear cells at d 2 of infection by the 3 strains. Data, mean ± SE (n = 6, **p < 0.01; *p < 0.05; two-tailed paired Student’s t-test). (c) Monocyte-derived macrophages were infected with GFP-transfected strain; at MOI of 2 for 2 d. Slides were made with DAPI staining for nucleic acid content. Representative infected cell of each strain, with also gray color as visible light showing bacteria inside of the limits of the cell (bar = 5 μm), with field showing more cells on smaller scale (bar = 100 μm). (d) Core genome phylogenetic analysis of 14 genomes; 3 BCG strains (BCG-vaccine, BCG-brain, and BCG-lung), 5 representative genomes of M. tuberculosis (H37Rv, CDC1551, F11, KZN 1435, and KZN 4207), and 6 M. bovis isolates (BAA_935, Tokyo 172, BCG1 Russia, BCG Pasteur 1173P2, BCG Danish 1331 Belgium, and BCG Denmark)](/cms/asset/1bc03b34-3040-4053-8984-27c15ebdc50b/kvir_a_1848108_f0001_oc.jpg)
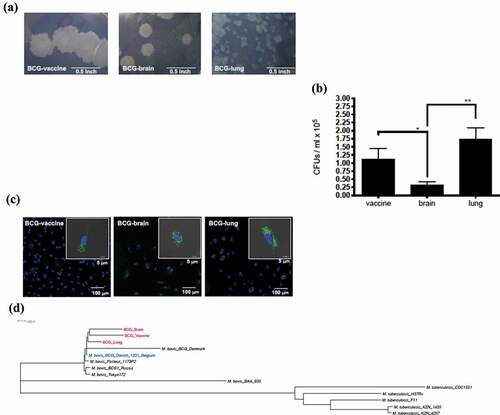
Table 2. Antibiotic MIC values of vaccine, lung, and brain Mycobacterium bovis BCG strains at 14 d. Values in bold represent MIC values associated with mutations as discussed in the text
Table 3. Identification of mutations in the clinical isolates that have M. tuberculosis H37Rv homologs
Figure 2. Mycobacterium bovis lipid profiles. TLC images of BCG-vaccine and clinical isolates from the BCG vaccinated patient with IFNγR1 deficiency are shown
![Figure 2. Mycobacterium bovis lipid profiles. TLC images of BCG-vaccine and clinical isolates from the BCG vaccinated patient with IFNγR1 deficiency are shown](/cms/asset/04b103b1-71b6-434c-8310-5eec2771dd46/kvir_a_1848108_f0002_b.gif)
Figure 3. Quantification of PDIMs, neutral lipids, and mycolic acids
![Figure 3. Quantification of PDIMs, neutral lipids, and mycolic acids](/cms/asset/798aee03-ec49-4a64-bc61-56b763f65247/kvir_a_1848108_f0003_b.gif)
Figure 4. Diminished apoptosis on infected cells by BCG-lung and BCG-brain strains and higher necrosis by infection with BCG-lung measured by LDH-release
![Figure 4. Diminished apoptosis on infected cells by BCG-lung and BCG-brain strains and higher necrosis by infection with BCG-lung measured by LDH-release](/cms/asset/dc29716c-1da0-4314-8176-cb95de1d4101/kvir_a_1848108_f0004_b.gif)
Figure 5. Infection of dTHP1 cells with the BCG-lung strain resulted in a higher secretion of cytokines. The supernatants of dTHP1 cells infected with the three strains of BCG at a MOI of 2 were used to quantify cytokines IL-1β, IL-18, IL-6, IL-10, TNF⍺, and GM-CSF secretion (A–F). Cytokine levels were compared to untreated cells and within cells infected with BCG isolates. Data, mean ± SD (n = 4; *p < 0.05 **p < 0.01; ANOVA)
![Figure 5. Infection of dTHP1 cells with the BCG-lung strain resulted in a higher secretion of cytokines. The supernatants of dTHP1 cells infected with the three strains of BCG at a MOI of 2 were used to quantify cytokines IL-1β, IL-18, IL-6, IL-10, TNF⍺, and GM-CSF secretion (A–F). Cytokine levels were compared to untreated cells and within cells infected with BCG isolates. Data, mean ± SD (n = 4; *p < 0.05 **p < 0.01; ANOVA)](/cms/asset/db6c58e0-9181-418f-9e85-44a8a0466303/kvir_a_1848108_f0005_b.gif)
Figure 6. Different alterations in STAT signaling between the lung and brain strains compared to the vaccine strain. Monocyte-derived macrophages infected at MOI of 2 with the three strains for 2 d were probed by western blot for: pSTAT1-Y701, STAT1 total, pSTAT5-Y694, STAT5total, SOCS3, and β-actin (n = 3 for STAT1 immunoblots and n = 4 for STAT5 and SOCS3 immunoblots). (A1), (B1), and (C1) representative blots and (A2), (B2), and (C2) are the cumulative data for the experiments. Data, mean ± SD (n ≥ 3; *p < 0.05, **p < 0.01, ***p < 0.001; ANOVA)
![Figure 6. Different alterations in STAT signaling between the lung and brain strains compared to the vaccine strain. Monocyte-derived macrophages infected at MOI of 2 with the three strains for 2 d were probed by western blot for: pSTAT1-Y701, STAT1 total, pSTAT5-Y694, STAT5total, SOCS3, and β-actin (n = 3 for STAT1 immunoblots and n = 4 for STAT5 and SOCS3 immunoblots). (A1), (B1), and (C1) representative blots and (A2), (B2), and (C2) are the cumulative data for the experiments. Data, mean ± SD (n ≥ 3; *p < 0.05, **p < 0.01, ***p < 0.001; ANOVA)](/cms/asset/fba5d201-68e3-4c1a-be10-b059c9fb2ffc/kvir_a_1848108_f0006_b.gif)