Figures & data
Figure 1. MoSec61β is involved in hyphal growth, asexual reproduction, cell wall integrity, and pathogenicity. (a) Growth of Guy11, ΔMosec61β, and Mosec61βc on CM plates. Strains were inoculated on CM plates for 8 days. (b) Conidiophores of wild-type, ΔMosec61β, and Mosec61βc. Bar = 50 μm. (c) Mycelial diameters of the wild-type, ΔMosec61β, and Mosec61βc strains. (d) Conidiation of Guy11, ΔMosec61β, and Mosec61βc. (e) Morphology of vegetative hyphae of Guy11, ΔMosec61β, and Mosec61βc on cover glass. Bar = 50 μm. (f) Vegetative hyphae of wild-type, ΔMosec61β, and Mosec61βc stained with CFW. White arrows point to the septa. Bar = 20 μm. (g) Strains were incubated on MM plates supplemented with various stress inducers at 25°C for 7 days. Growth of strains in media supplemented with 0.0025% SDS, 100 μg/mL CFW, and 50 μg/mL Congo red (CR). (h) Pathogenicity on barley leaves. Twenty microliters conidial drops (5 × 10⁴ mL−1) were inoculated on barley leaves. Photographs were taken after 4 dpi. (i) Pathogenicity of rice seedlings. Conidia (5 × 10⁴ mL−1) were sprayed on 21-day-old rice seedlings. Photographs were taken after 7 dpi. (j) Disease score assays for Guy11, ΔMosec61β, and Mosec61βc. The proportion of lesion areas in 5-cm leaves was measured by Photoshop CS6. Error bars represent the standard deviation. Significant differences between the mutant and wild-type strains, as estimated by Duncan’s test: **P < 0.01, *P < 0.05
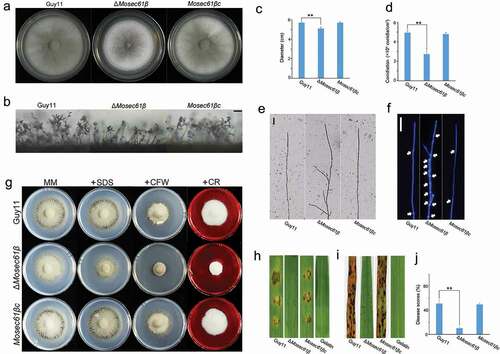
Figure 2. MoSec61β is required for plant penetration and invasive growth. (a) Penetration assays on barley leaves were performed after 12, 24, 48, and 72 hpi. Bar = 50 μm. (b) The rate of penetration peg formation of Guy11, ΔMosec61β, and Mosec61βc. (c) Penetration rate of appressoria at 48 hpi and 72 hpi. (d) The percentage of invasive hyphae extended to adjacent cells at 48 hpi and 72 hpi. Error bars represent the standard deviation. Significant differences between the mutant and wild-type strains, as estimated by Duncan’s test: **P < 0.01, *P < 0.05
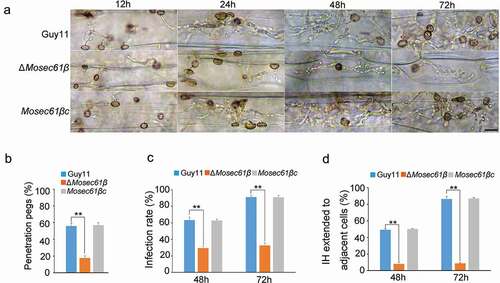
Figure 3. (a) Collapse of appressoria at 0.5 M glycerol. 5 Bar = 20 μm. (b) A 0.5–1.5 molar concentration of glycerol solution was applied to examine the collapse rate of appressoria in Guy11, ΔMosec61β, and Mosec61βc. Arrows indicate the collapsed appressoria. (c) Cellular distribution of lipid droplets during appressorium development. Samples were stained with Nile red and observed with UV epifluorescence. The lipid droplets show a red signal fluorescence. Bar = 20 μm. (d) The percentage of conidia containing lipid droplets during appressorial development. (e) The percentage of appressoria containing lipid droplets. (f) Cellular distribution of glycogen during appressorium development. Bar = 20 μm. Samples were stained with KI/I2 solution at the indicated time phase. The glycogen appears as dark brown deposits. (g) The percentage of conidia containing glycogen. (h) The percentage of appressoria containing glycogen during appressorium development. Error bars represent the standard deviation. Significant differences compared with the wild-type strain were estimated by Duncan’s test: **P < 0.01, *P < 0.05
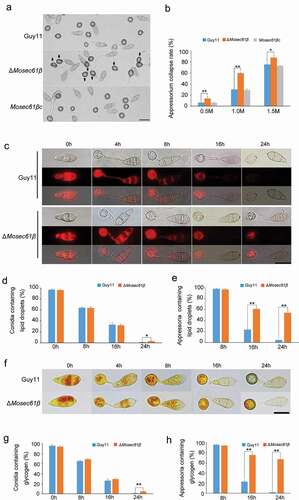
Figure 4. ΔMosec61β is sensitive to oxidative stress and cannot scavenge ROS. (a) M. oryzae strains grown on 5.0 mM H2O2. (b) Relative growth of mycelial colonies on 5.0 mM H2O2. (c) Reactive oxygen species (ROS) capture by 3,30-diaminobenzidine (DAB) staining in infected barley leaves. Bar = 20 μm. (d) ROS capture by DAB staining in infected rice leaf sheaths at 48 hpi. White thick arrows point to the invasive hyphae, white thin arrows point to orange brown granules. Bar = 20 μm. (e) The percentage of M. oryzae strains that can induce brown granules. (f) Percentage of appressorium-mediated penetration and infectious hyphae development of Guy11 and ΔMosec61β in DPI-treated rice sheaths. Error bars represent the standard deviation. Significant differences compared with the wild-type strain were estimated by Duncan’s test: **P < 0.01, *P < 0.05
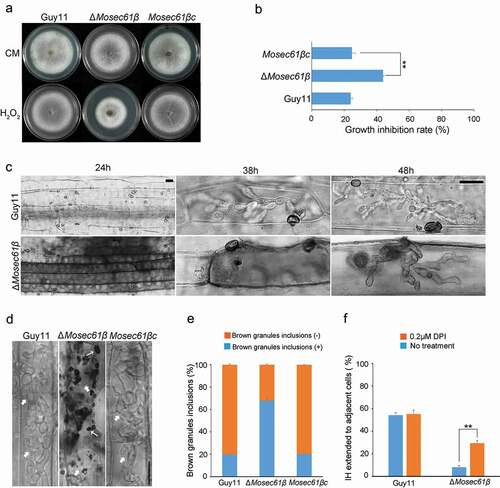
Figure 5. Penetration assays with heat-killed rice leaf sheaths and onion epidermis. (a) Conidia solution was inoculated into normal or heat-treated leaf sheaths, and infection was observed after 48 hpi. Bar = 20 μm. Black arrows point to IH. White arrows point to IH, which was expanded in adjacent cells. (b) Conidia solution was inoculated into normal or heat-treated onion epidermal cells, and infection was observed after 48 hpi. Bar = 20 μm. Black arrows point to IH. White arrows point to IH, which was expanded in adjacent cells. (c) Statistical analysis of the infection rate of the appressoria of the M. oryzae strains in leaf sheaths at 48 hpi. (d) The percentage of invasive hyphae extended to adjacent cells in normal or heat-treated leaf sheaths at 48 hpi. Error bars represent the standard deviation. Significant differences compared with the wild-type strain were estimated by Duncan’s test: **P < 0.01, *P < 0.05
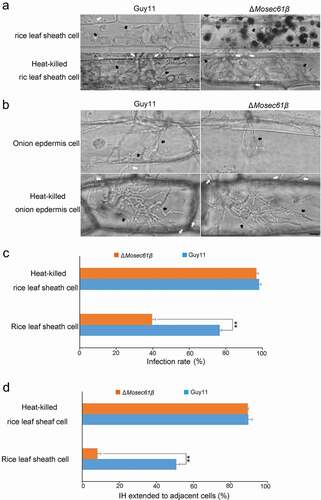
Figure 6. Callose deposition in barley leaves. (a) Deposited callose in leave cells under different treatment. Arrows indicate the callose depositions. app: appressorium. Bar = 10 μm. (b) The number of callose deposition per 50 μm length of side wall at 32 h. Error bars represent the standard deviation. Significant differences compared with the wild-type strain were estimated by Duncan’s test: **P < 0.01, *P < 0.05. (c) The expression level of callose synthase-encoding genes (OsGSL1, OsGSL3, and OsGSL5) in Guy11 and ΔMosec61β-challenged rice leaves
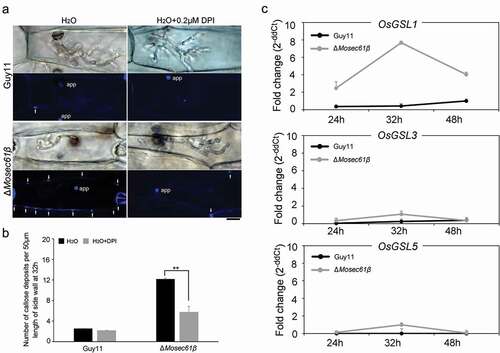
Figure 7. Distribution of effectors in IH of M. oryzae strains. (a) Fluorescence localization of the Pwl2 cytoplasmic effector in a rice sheath infected with M. oryzae. Bar = 20 μm. (b) Distribution of the apoplastic effectors Bas4 and Slp1 in wild-type and ΔMosec61β. Bar = 20 μm. (c) Statistical analysis of the localization of the two types of fluorescent effectors in M. oryzae. Error bars represent the standard deviation
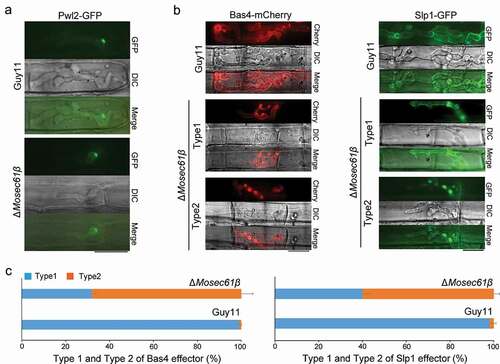
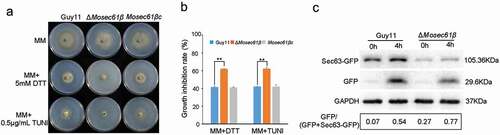
Figure 8. Responses of M. oryzae strains to ER stress. (a) Mycelial colonies of Guy11, ΔMosec61β, and Mosec61βc cultured on MM media containing 0.5 μg/mL TUNI and 5.0 mM DTT at 25°C with a 16 h light and 8 h dark cycle for 8 days. (b) Growth inhibition rate of mycelial colonies on 0.5 μg/mL TUNI and 5.0 mM DTT. (c) ER-phagy of Sec63-GFP in Guy11 and ΔMosec61β. Total proteins were extracted from the Sec63-GFP expressed strains exposed to nitrogen starvation conditions with 5 μM DDT for 0 and 4 h. Full-length Sec63-GFP and free GFP were detected using GFP antibodies as described in the Materials and Methods. The extent of ER-phagy was estimated by calculating the amount of free GFP compared with the total amount of intact Sec63-GFP and free GFP. Quantitative analysis of the individual bands was performed using ImageJ software. Error bars represent the standard deviation. Significant differences between the mutant and wild-type strains, as estimated by Duncan’s test: **P < 0.01, *P < 0.05