1,746
Views
7
CrossRef citations to date
0
Altmetric
Research Paper

Roles of the Hcp family proteins in the pathogenicity of Salmonella typhimurium 14028s

, , , &
Pages 1716-1726 | Received 19 Feb 2020, Accepted 18 Nov 2020, Published online: 10 Dec 2020

Figures & data

Table 1. Effects of hcp mutations on the MICs of antimicrobials

Figure 1. Growth characters in LB (a) and M9-glucose minimum medium (b), biofilm formation ability (c) and motility (d) of wild type and mutant strains. Motility of the wild type and mutant strains was determined by measuring the diameter of the column. Error bars represent the SDs. Significant differences were defined by P < 0.05 (*), P < 0.01 (**), and P < 0.001 (***) compared to the wild type strain 14028s
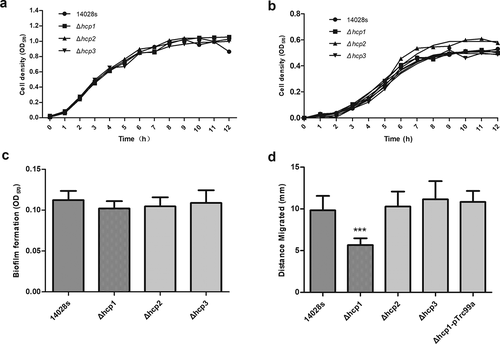
Figure 1. Growth characters in LB (a) and M9-glucose minimum medium (b), biofilm formation ability (c) and motility (d) of wild type and mutant strains. Motility of the wild type and mutant strains was determined by measuring the diameter of the column. Error bars represent the SDs. Significant differences were defined by P < 0.05 (*), P < 0.01 (**), and P < 0.001 (***) compared to the wild type strain 14028s
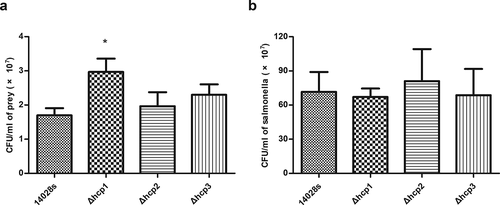
Figure 2. Results of bacterial competition assay. The surviving prey (E.coli JM109) (a) and the surviving salmonella strains (b) after 12 h co-incubation on LB plate supplemented with 0.05% porcine bile salts were measured by counting CFU. Error bars represent the SDs. Significant differences were defined by P < 0.05 (*), P < 0.01 (**), and P < 0.001 (***) compared to the wild type strain 14028s
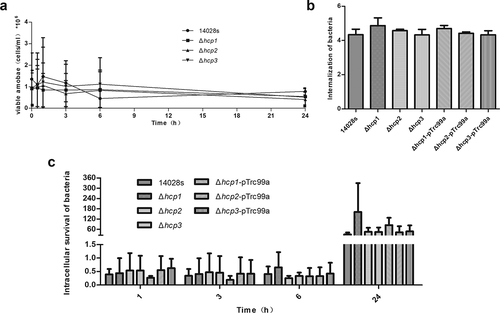
Figure 2. Results of bacterial competition assay. The surviving prey (E.coli JM109) (a) and the surviving salmonella strains (b) after 12 h co-incubation on LB plate supplemented with 0.05% porcine bile salts were measured by counting CFU. Error bars represent the SDs. Significant differences were defined by P < 0.05 (*), P < 0.01 (**), and P < 0.001 (***) compared to the wild type strain 14028s

Figure 3. The population of viable amoebae at each time point when incubated with the wild type and mutant strains (a) were tested by Trypan blue exclusion and counting on a Neubauer chamber. The internalization of the wild type and mutant strains in D.discoideum (b) were calculated as CFUt=0/CFUinoculum and converted negative logarithmically. The intracellular survival of the wild type and mutant strains in D.discoideum (c) were calculated at each time point as CFUt=x/CFUt=0. Error bars represent the SDs. Significant differences were defined by P < 0.05 (*), P < 0.01 (**), and P < 0.001 (***) compared to the wild type strain 14028s

Figure 3. The population of viable amoebae at each time point when incubated with the wild type and mutant strains (a) were tested by Trypan blue exclusion and counting on a Neubauer chamber. The internalization of the wild type and mutant strains in D.discoideum (b) were calculated as CFUt=0/CFUinoculum and converted negative logarithmically. The intracellular survival of the wild type and mutant strains in D.discoideum (c) were calculated at each time point as CFUt=x/CFUt=0. Error bars represent the SDs. Significant differences were defined by P < 0.05 (*), P < 0.01 (**), and P < 0.001 (***) compared to the wild type strain 14028s

Figure 4. Virulence of the wild type and mutant strains in mouse model of systemic infection were determined by examining the bacteria concentrations in different organs (colon, spleen, and liver)
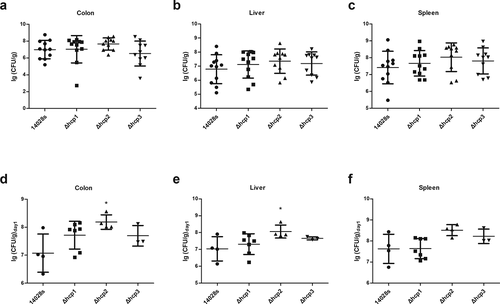
(a–c) Colonization ability in different organs of mice. (d–f) Colonization ability in different organs of mice that was dead within 24 h after inoculation. Error bars represent the SDs. Significant differences were defined by P < 0.05 (*), P < 0.01 (**), and P < 0.001 (***) compared to the wild type strain 14028s.
Figure 4. Virulence of the wild type and mutant strains in mouse model of systemic infection were determined by examining the bacteria concentrations in different organs (colon, spleen, and liver)

Figure 5. Interactions of the three Hcps were tested by qRT-PCR and bacteria two-hybrid assay. (a–c) The normalized expression level (2−ΔΔct) of hcps of the wild type and mutant strains. 16S rRNA was used as the internal parameter. Error bars represent the SDs. Significant differences were defined by P < 0.05 (*), P < 0.01 (**), and P < 0.001 (***) compared to the wild type strain 14028s. (d) Bacteria two-hybrid analyses. Different strains that have different plasmid combinations were spotted on dual selective screening plate and nonselective screening plate respectively at 30°C for 24 h. The strains can grow on the dual selective screening plate if the proteins on the plasmids can interact. The experiments were done at least in triplicate, and a representative result is shown
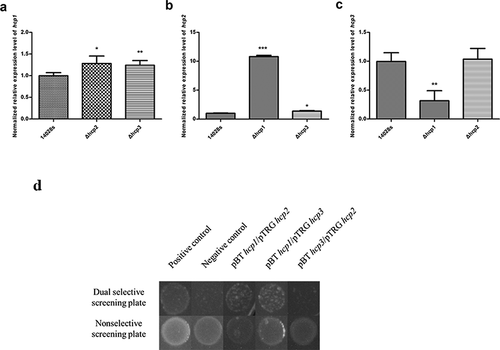
Figure 5. Interactions of the three Hcps were tested by qRT-PCR and bacteria two-hybrid assay. (a–c) The normalized expression level (2−ΔΔct) of hcps of the wild type and mutant strains. 16S rRNA was used as the internal parameter. Error bars represent the SDs. Significant differences were defined by P < 0.05 (*), P < 0.01 (**), and P < 0.001 (***) compared to the wild type strain 14028s. (d) Bacteria two-hybrid analyses. Different strains that have different plasmid combinations were spotted on dual selective screening plate and nonselective screening plate respectively at 30°C for 24 h. The strains can grow on the dual selective screening plate if the proteins on the plasmids can interact. The experiments were done at least in triplicate, and a representative result is shown

Figure 6. The normalized expression level (2−ΔΔct) of rpoS(a), flagellar genes flhd (b), flia (c), flic (d), fljb (e), and fimH (f) of the wild type and mutant strains were tested by qRT-PCR. 16S rRNA was used as the internal parameter. Error bars represent the SDs. Significant differences were defined by P < 0.05 (*), P < 0.01 (**), and P < 0.001 (***) compared to the wild type strain 14028s
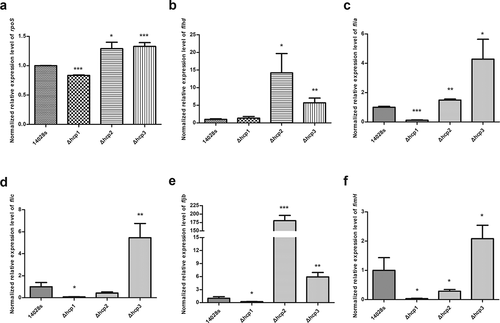
Figure 6. The normalized expression level (2−ΔΔct) of rpoS(a), flagellar genes flhd (b), flia (c), flic (d), fljb (e), and fimH (f) of the wild type and mutant strains were tested by qRT-PCR. 16S rRNA was used as the internal parameter. Error bars represent the SDs. Significant differences were defined by P < 0.05 (*), P < 0.01 (**), and P < 0.001 (***) compared to the wild type strain 14028s
Supplemental material

Supplemental Material

Download Zip (239.8 KB)