
Figures & data
Table 1. Patients’ demographics, clinical features, and antibiotic therapy
Figure 1. Graphical representation of exclusive protein-coding genes between pairs of CRAB clinical isolates. The records in the matrix represent the number of exclusive protein-coding genes between compared isolates (e. g., 320 is the number of exclusive protein-coding genes in the B1-B1 couple (i. e., B1 compared with itself), so no isolate other than B1 has these 320 protein-coding genes). The higher the number of exclusively shared protein-coding genes between compared isolates, the darker the green of the matrix cell. Isolates from non-surviving patients and surviving patients are highlighted in red and green colors, respectively. The corresponding STs following the Pasteur and Oxford schemes are also shown
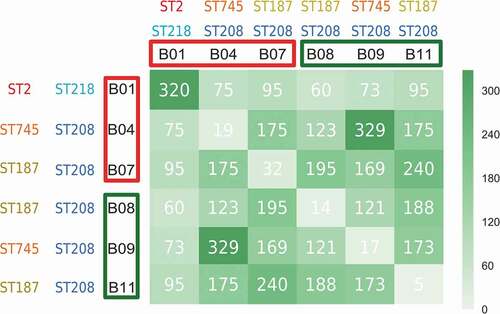
Figure 2. Alignment of CarO amino acids sequences from the six CRAB clinical isolates. The numbers represent the positions of amino acids. CarO protein was intact in the isolates from non-surviving patients (B1, B4, and B7), while it was truncated in those from surviving patients (B8, B9, and B11). The secondary structure obtained from the PDB structure 4fuv.1.A is shown in the 3D-Model track: α-helices in red color, and β-strands in green color. The eight strands from the CarO β-barrel have been tagged (β1-β8)
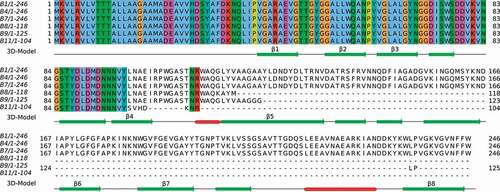
Figure 3. Immunodetection of CarO in outer membrane protein profiles. Outer membrane fractions were extracted from the bacteremic CRAB clinical isolates from non-surviving patients (B1, B4, and B7) and from surviving patients (B8, B9, and B11), and subjected to sodium dodecyl sulfate polyacrylamide gel electrophoresis (SDS-PAGE), followed by immunoblotting with polyclonal rabbit antibodies toward A. baumannii CarO. Molecular weight standards (kDa) are shown on the left. Black arrow on the right indicate the final position of CarO. MW, molecular weight
Figure 4. A. baumannii adherence and invasion into human lung A549 cells. A549 cell cultures were incubated with two reference A. baumannii strains: ATCC 17978 and ATCC 19606 wild-type (17978 and 19606); their isogenic carO deletion mutants (17978 ΔcarO and 19606 ΔcarO); both 17978 wt and 19606 wt with empty plasmid pWH1266 as controls (17978/pWH1266 and 19606/pWH1266); both 17978 ΔcarO and 19606 ΔcarO mutants with empty plasmid as controls (17978 ΔcarO/pWH1266 and 19606 ΔcarO/pWH1266); 17978 ΔcarO and 19606 ΔcarO mutants with plasmid pWH1266-carO expressing CarO (17978 ΔcarO/pWH1266-carO and 19606 ΔcarO/pWH1266-carO); and with the two CRAB clinical isolates B4 and B9. The percentages of bacterial adherence (a) and invasion (b) were subsequently measured. Data are represented as mean ± SEM (n = 3 replicates in different days). *P < 0.05, ** P < 0.01, *** P < 0.001, **** P < 0.0001, Student’s t-test and Mann-Whitney test
Figure 5. Analysis of mice survival time in the peritoneal sepsis model by (a) 3.20 log10 CFU/mL of A. baumannii ATCC 17978 wt (17978), its isogenic ΔcarO mutant (17978 ΔcarO), and the complemented strain (17978 ΔcarO/pWH1266-carO) (n = 6 mice/strain); and by (b) 4.00 log10 CFU/mL of the A. baumannii clinical isolates B4 and B9 (n = 4 mice/isolate). Survival curves showed the percentages of mice survival during 7 days. P = 0.03 for 17978 vs. 17978 ΔcarO, and P = 0.04 for B4 vs. B9, log-rank test
Figure 6. Bacterial burdens in peritoneal sepsis murine model. Bacterial loads in tissues and fluids were determined at 8 h and 24 h after intraperitoneal infection with 3.2 log10 CFU/mL of A. baumannii ATCC 17978 wild-type (17978), its isogenic carO deletion mutant (17978 ΔcarO), and the ΔcarO complemented strain (17978 ΔcarO/pWH1266-carO). Data are represented as mean ± SEM (n = 7 mice/strain for each time point). *P < 0.05, ** P < 0.01, *** P < 0.001, Student’s t-test and Mann-Whitney test
Supplemental Material
Download MS Excel (14.6 KB)Supplemental Material
Download MS Excel (15.6 KB)Supplemental Material
Download MS Word (23 KB)Supplemental Material
Download Zip (182.9 KB)Data availability
The sequences reported in this paper have been deposited in the National Center for Biotechnology BioProject database (accession number PRJNA417465): PKON00000000 (B1), PKOO00000000 (B4), PKOP00000000 (B7), PKOQ00000000 (B8), PKOS00000000 (B9), and PKOR00000000 (B11).