
Figures & data
Figure 1. Examination of captured proteins by SDS-PAGE and Western blot. The region extending ~400 bp upstream of the genes and/or operons encoding extracellular proteases indicated on the left were used as DNA baits to capture proteins from whole cell lysates prepared from the USA300 strain LAC or its isogenic sarA mutant (ΔsarA). Proteins were eluted with increasing concentrations of salt and examined by SDS-PAGE (left side of each panel) and Western blot using an anti-SarA antibody (right side of each panel). Control samples included experiments done with a LAC lysate and no DNA ait (top)
Figure 2. Relative impact of regulatory mutations on protease activity. Protease activity in conditioned medium (CM) from stationary phase cultures from LAC (top), UAMS-1(bottom), and each of the indicated isogenic regulatory mutants was assessed using a gelatin-based FRET assay. Results are reported as the average ± standard error of the mean from two biological replicates, each of which included three experimental replicates. Asterisk indicates statistical significance by comparison to the results observed with the isogenic parent strain. Doubles asterisks indicate statistical significance by comparison to the isogenic sarA mutant
Figure 3. Relative impact of regulatory loci on expression of individual protease genes and operons in LAC and UAMS-1. The indicated pCM11 gfp reporter plasmids were introduced into LAC, UAMS-1 and each of the isogenic regulatory mutants. Results are reported as the average mean fluorescence intensity ± standard error of the mean from two biological replicates, each of which included three experimental replicates. Asterisk indicates statistical significance by comparison to the results observed with the isogenic parent strain. Doubles asterisks indicate statistical significance by comparison to the isogenic sarA mutant
Figure 4. Relative impact of regulatory loci on protein abundance. Top: SDS-PAGE of conditioned medium (CM) from LAC (top), UAMS-1 (bottom) and isogenic regulatory mutants generated in each parent strain. Bottom: Western blots of CM from the same strains using antibodies for alpha toxin (Hla, top), protein A (Spa, left), and Nuc1 (right). Purified alpha toxin (Hla) was included as a control for alpha toxin blots (UAMS-1 does not produce alpha toxin), while protein A and nuc1 mutants (Δspa and Δnuc1, respectively) were included as controls for the protein A and Nuc1 blots
Figure 5. Relative impact of regulatory loci on biofilm formation. Biofilm formation was assessed in LAC (top), UAMS-1 (bottom) and their isogenic regulatory mutants. Results are reported as the average ± standard error of the mean from two biological replicates, each of which included six experimental replicates. Asterisk indicates statistical significance by comparison to the results observed with the isogenic parent strain. Doubles asterisks indicate statistical significance by comparison to the isogenic sarA mutant
Figure 6. Impact of the functional status of regulatory mutations on protease production in isogenic sarA mutants. Protease activity in conditioned medium (CM) from stationary phase cultures from LAC, UAMS-1, and each of the indicated isogenic regulatory mutants was assessed using a gelatin-based FRET assay. Results are reported as the average ± standard error of the mean from two biological replicates, each of which included three experimental replicates. Asterisk indicates statistical significance by comparison to the results observed with the isogenic parent strain. Doubles asterisks indicate statistical significance by comparison to the isogenic sarA mutant
Figure 7. Impact of the functional status of regulatory mutations on expression of protease genes/operons in LAC sarA mutants and UAMS-1 sarA mutants. pCM11 gfp reporter plasmids were introduced into LAC or UAMS-1 and the indicated regulatory mutants. Results are reported as the average mean fluorescence intensity ± standard error of the mean from two biological replicates, each of which included three experimental replicates. Asterisk indicates statistical significance by comparison to the results observed with the isogenic parent strain. Doubles asterisks indicate statistical significance by comparison to the isogenic sarA mutant
Figure 8. Relative impact of regulatory loci on protein abundance. Top: SDS-PAGE of conditioned medium (CM) from LAC (left), UAMS-1 (right), their isogenic sarA mutants, and isogenic sarA mutants with additional mutations in the genes encoding each of the other regulatory proteins examined in this study. Bottom: Western blots of CM from the same strains using antibodies for alpha toxin (Hla, top), protein A (Spa, left), and Nuc1 (right). Purified alpha toxin (Hla) was included as a control for alpha toxin blots (UAMS-1 does not produce alpha toxin), while protein A and nuc1 mutants (Δspa and Δnuc1, respectively) were included as controls for the protein A and Nuc1 blots
Figure 9. Relative impact of regulatory loci on biofilm formation. Biofilm formation was assessed in LAC (top), UAMS-1 (bottom), their isogenic sarA mutants, and isogenic sarA mutants with additional mutations in the genes encoding each of the other regulatory proteins examined in this study. Results are reported as the average ± standard error of the mean from two biological replicates, each of which included six experimental replicates. Asterisk indicates statistical significance by comparison to the results observed with the isogenic parent strain. Doubles asterisks indicate statistical significance by comparison to the isogenic sarA mutant
Figure 10. Differential protein binding to the spl (left) and the aureolysin (right) promoters in LAC versus the isogenic ΔsarA mutant. Volcano plots were generated based on fold-change of protein levels using the averaged spectral counts from biological triplicates. The x-axis indicates a log2 fold-change, and the y-axis indicates −log10 p-value based on the Student’s t-test. The horizontal line indicates a p-value <0.05, and the vertical lines represent a fold-change >2. Proteins in which the abundance was reduced to a statistically significant degree in ΔsarA lysates compared to wild-type lysates are shown as red dots in the upper right quadrant, whereas those that were present in increased amounts are shown as blue circles in the upper left quadrant. Black dots indicate proteins for which differences in abundance were not statistically significant
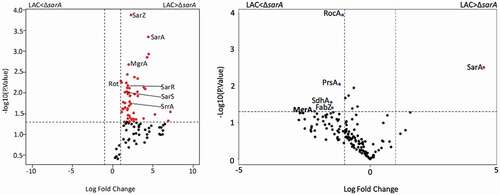
Figure 11. Impact of individual proteases on accumulation of alpha toxin (top) and cytotoxicity (bottom). Top: Conditioned medium (CM) from the indicated strains was resolved by SDS-PAGE prior to Western blotting with an anti-alpha toxin antibody. The control consists of purified alpha toxin. As previously described, this commercially available antibody is cross-reactive with gamma toxin.13,60 Bottom: Cytotoxicity was assessed using conditioned medium (CM) from stationary phase cultures of LAC (WT), its isogenic sarA mutant, and derivatives of the sarA mutant unable to produce the indicted proteases. Assays were done with RAW (left) or MC3T3 cells (right) as surrogates for primary osteoclasts and osteoblasts, respectively. Results are reported as relative viability. Single asterisk indicates a statistically significant increase in viability by comparison to CM from LAC (WT)
Figure 12. Impact of individual specific proteases on biofilm formation. Biofilm formation was assessed using a microtiter plate assay as previously described.16 WT refers to LAC (left) or UAMS-1 (right). “Total” refers to a sarA mutant unable to produce any extracellular protease. “Total + spl” refers to a sarA mutant unable to produce any extracellular protease other than those encoded by the spl operon. All other designations indicate the genes encoding specific proteases that were mutated in the LAC or UAMS-1 sarA mutants. Single asterisk indicates statistical significance relative to the isogenic parent strain. Double asterisks indicate statistical significance relative to the isogenic sarA mutant
Figure 13. Characterization of regions containing cis active elements that contribute to SarA-mediated repression of extracellular proteases. Constructs containing the indicated number of base pairs upstream of each protease gene/operon translational start site were used to generate truncated versions of the pCM11 gfp reporter plasmid indicated in each panel. These were then introduced into LAC and its sarA mutant and fluorescence assessed after ON growth. Results are reported as the average mean fluorescence intensity ± standard error of the mean from two biological replicates, each of which included three experimental replicates. The sequence below each panel illustrates the region upstream of each protease gene/operon with the region containing putative SarA binding sites (bold italics), putative −35, −10, and ribosome-binding sites (bold underlined), and transcriptional and translational start sites (underlined)
Table 1. Bacterial strains used in this study
Table 2. List of oligonucleotides used to amplify the protease promoter elements
Table 3. List of plasmids and oligonucleotides used in this study