Figures & data
Table 1. Plasmids and primers used in this study
Table 2. Equations used for fluorescence image analysis and hemolysis assay
Figure 1. Mm(EsxB-DAS4+) has a reduced expression and secretion of EsxB-DAS4+, but it still exhibited a higher intracellular survival than Mm(ΔEsxA:B). (a) The culture filtrates (CF) and cell lysates (CL) of Mm(WT) and Mm(EsxB-DAS4+) were applied to SDS-PAGE, and the expression and secretion of EsxB or EsxB-DAS4+ were detected with Western blots by using anti-EsxB serum. The secretion of EsxA in CF was detected with anti-EsxA antibody. GroEL and Ag85B were also detected as the controls for CF and CL, respectively. (b) WI-26 cells were infected with Mm(WT), Mm(EsxB-DAS4+) and Mm(ΔEsxA:B) at MOI = 2, respectively. At 2, 24 and 48 hpi, the cells were lysed for CFU counting. For each strain, the CFU at 24 and 48 hpi was calculated to the percentage of the CFU at 2 hpi. The experiment was replicated three times and the data is presented as mean ± SD. The statistical analysis was performed with One-way ANOVA method, followed by Holm-Sidak multiple comparisons. **P< 0.01, ****P< 0.0001
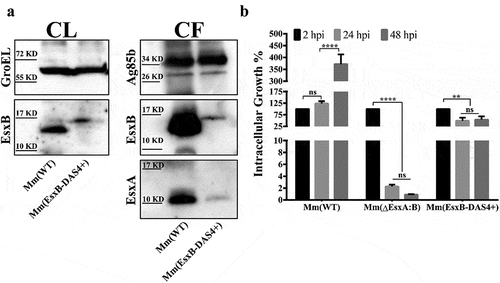
Figure 2. ATC-induced knockdown of EsxB-DAS4+ at the post-translational level. (a) The Mm(EsxB-DAS4+)|pGMCKq1 culture was treated without ATC or with ATC (0.5 μg/ml) for the indicated times. As a control, the Mm(WT) culture was also treated with ATC (0.5 μg/ml) for 48 h. The expression of EsxB-DAS4+ and EsxA were detected by Western blots. The bands of EsxB and EsxB-DAS4+ are designated with arrows. (b) The relative mRNA level of EsxB-DAS4+ after 24 h and 48 h of ATC treatment was determined by RT-qPCR. The data from the non-ATC treated group was used as a control. The experiment was replicated for three times and the data is presented as mean ± SD. The statistical analysis was performed with t tests. (c) The mCherry-expressing Mm(EsxB-DAS4+)|pGMCKq1 cells were treated without or with ATC (0.5 μg/ml) for 48 h. Then the bacteria were incubated with anti-EsxB serum, followed by FITC-labeled secondary antibody, to detect the bacteria-associated EsxB-DAS4 +. Images from all groups were taken under a LSM700 confocal fluorescence microscopy with the same configuration. For each strain, 12 random sights were taken from two replicate wells. The scale bar represents 50 µm. (d) The Green/Red overlap ratio in the randomly selected fields was quantified. The left fragment of X-axis ranges from 0 to 0.004, and the right fragment ranges from 0.02 to 0.4. The IFA assay were replicated for three times and the data is presented as mean ± SD. The statistical analysis was performed with One-way ANOVA method, followed by Holm-Sidak multiple comparison. ****< 0.0001
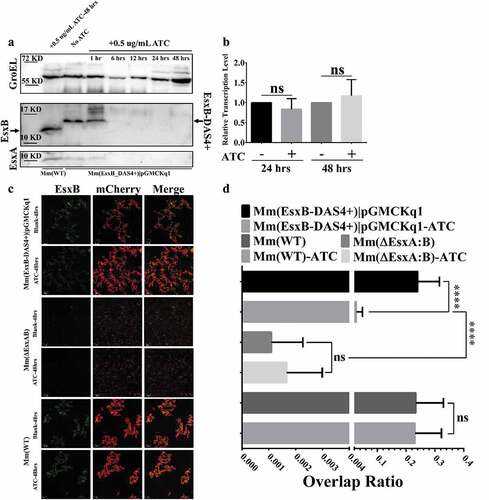
Figure 3. Inducible knockdown of EsxB reduced Mm intracellular survival. (a) Mm(EsxB-DAS4+)|pGMCKq1 and Mm(WT) were treated with/out ATC (0.5 μg/ml) for 48 h before single cell preparation. Then it was used to infect WI-26 cells at MOI = 2. At 48 hpi, the cells were collected and subjected to intracellular survival assay (CFU/well). The strains without ATC induction were used as controls. (b) WI-26 cells were treated with ATC at various concentrations for 48 h. The cytotoxicity was measured by LDH release assay. (c) WI-26 cells were infected with Mm(EsxB-DAS4+)|pGMCKq1 and Mm at MOI = 2. At 2 hpi, ATC (5 μg/ml) was added to the cell culture to induce degradation of EsxB-DAS4 +. At 24 and 48 hpi, the cells were harvested and subjected to intracellular survival assay (CFU/well). (d) Similarly, THP-1 cells were infected with Mm(EsxB-DAS4+)|pGMCKq1 or Mm at MOI = 1. At 2 hpi, ATC (5 μg/ml) was added to the cell culture to induce EsxB-DAS4+ degradation. At 24 and 48 hpi, the cells were harvested and subjected to intracellular survival assay (CFU/well). The cells without ATC addition were used as controls. The experiments were replicated for three times and the data is presented as mean ± SD. For cytotoxicity data, the statistical analysis was performed with One-way ANOVA, followed by Holm-Sidak multiple comparison. For CFU data, the statistical analysis was performed with multiple t test between ATC treated and nontreated groups of each strain. *< 0.05
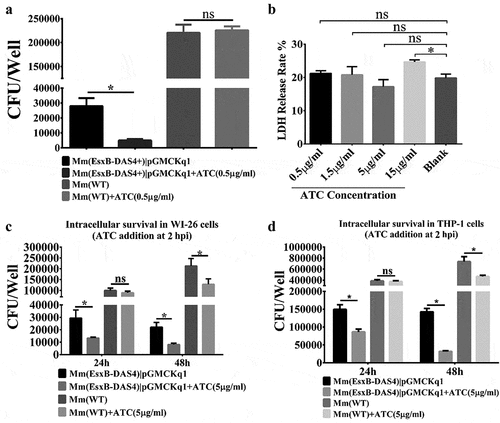
Figure 4. Insertion of ST at the C-terminus of EsxA didn’t affect Mm intracellular survival and allowed post-secretional labeling of EsxA by SpyCatcher(SC)-GFP. (a) The total lysate of Mm(EsxA-ST) were incubated with the purified SpyCatcher(SC)-GFP. The purified EsxA was incubated with SC-GFP as a control. The samples were subjected to Western blots. EsxA, EsxA-ST and EsxA-ST-SC-GFP were detected with anti-EsxA antibody. (b) SC-GFP and EsxA-ST-SC-GFP were detected with anti-GFP antibody. (c) The mCherry-expressing Mm(EsxA-ST) and Mm(WT) were incubated with SC-GFP. The images were taken under a LSM700 confocal fluorescence microscopy with the same configuration. For each strain, 12 random sights were taken from two replicate wells. The scale bar represents 20 µm. (d) The Green/Red overlap ratio in the randomly selected fields was quantified. The SC-GFP labeling assay was replicated for three times and the data is presented as mean ± SD. The statistical analysis was performed with t-test. ****< 0.0001. (e) The culture filtrates (CF) and cell lysates (CL) of Mm(WT) and Mm(EsxA-ST) were applied to Western blots, and the expression and secretion of EsxA or EsxA-ST were detected with anti-EsxA antibody. GroEL and Ag85B were detected as loading controls for CF and CL, respectively. GroEL was also detected in CF to make sure the EsxA-ST could be successfully secreted. (f) A549 cells were infected with Mm(WT), Mm(EsxA-ST) and Mm(ΔEsxA:B) at MOI = 2, respectively. At 2, 24 and 48 hpi, the cells were collected and subjected to intracellular survival tests. For each strain, the CFU of 24 and 48 hpi was counted and calculated to the percentage of the CFU at 2 hpi. The experiment was replicated for three times and the data is presented as mean ± SD. The statistical analysis was performed with One-way ANOVA method, followed by Holm-Sidak multiple comparisons. ****< 0.0001
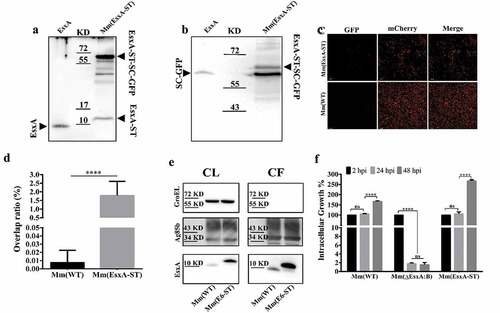
Figure 5. SC-GFP inhibited both the MPA of EsxA-ST and the bacteria-induced hemolysis of sheep RBCs. (a) The liposomes containing ANTS (fluorophore) and DPX (quencher) were incubated with the indicated proteins at either pH 7 or pH 4. The dequenching of ANTS fluorescence was recorded with times. (b) The relative fluorescence intensity change between 30 s and 210 s was calculated for each group. (c) Mm(WT), Mm(EsxA-ST) and Mm(ΔEsxA:B) were incubated with SC-GFP at RT, and then same bacterial amount of the strains with or without SC-GFP treatment were incubated with sheep RBCs to test hemolysis. The sheep RBCs incubated with PBS and Triton X-100 solution were used as the blank and positive control to calculate each strain’s hemolysis percentage. The experiments were replicated for three times, the data in curve graph is presented as mean, while the data in column graphs are presented as mean ± SD. For liposome leakage assay, statistical analysis was performed with One-way ANOVA method, followed by Holm-Sidak multiple comparison. For hemolysis assay, statistical analysis within each strain was performed with t-test. Statistical analysis between Mm(EsxA-ST) and Mm(ΔEsxA:B) was performed with One-way ANOVA method, followed by Holm-Sidak multiple comparison. *< 0.05, **P< 0.01, ***P< 0.001
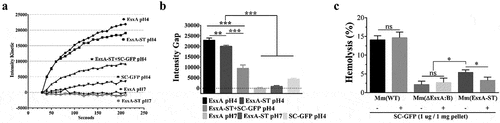
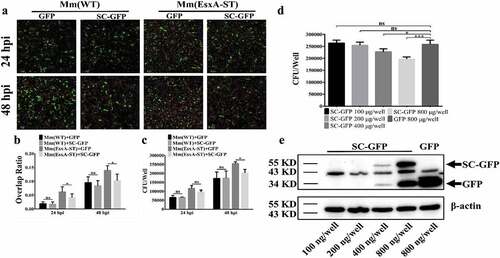
Figure 6. Endogenous expression of SC-GFP reduced Mm(EsxA-ST) intracellular survival in lung epithelial cells. (a) A549 cells were transiently transfected with pcDNA3.1-GFP or pcDNA3.1-SC-GFP. After 24 h of transfection, A549 cells were infected with Mm(WT) or Mm(EsxA-ST) at MOI = 2, respectively. At 24 and 48 hpi, the cells were fixed and images were taken at green channel and red channel to visualize GFP/SC-GFP and mCherry-expressing bacteria. For each strain, 12 random sights were taken from two replicate wells. Scale bar represents 50 μm. (b) The Red/Green overlap ratio of the cells in randomly selected fields was calculated to evaluate bacterial intracellular survival in transfect cells. (c) A549 cells were transiently transfected with pcDNA3.1-GFP or pcDNA3.1-SC-GFP. After 24 h of transfection, A549 cells were infected with Mm and Mm(EsxA-ST) at MOI = 2, respectively. At 24 and 48 hpi, the cells were harvested and subjected to CFU counting for intracellular survival. (d) A549 cells were transiently transfected with different concentrations of pcDNA3.1-SC-GFP DNA. After 24 h of transfection, A549 cells were infected with Mm(EsxA-ST) at MOI = 2. At 48 hpi, the cells were harvested and subjected to CFU counting for intracellular survival. The cells transfected with pcDNA3.1-GFP were used as the control. (e) The expression of SC-GFP in each transfection dose was detected with Western blots using anti-GFP antibody. The bands of SC-GFP and GPF are designated with arrows. β-actin was detected as a loading control. The intracellular survival experiment was replicated for three times and data is presented as mean ± SD. For the data in (B) and (C), statistical analysis was performed with multiple t-test between GFP and SC-GFP groups of each strain. *P< 0.05. For the data in (D), statistical analysis was performed with One-way ANOVA method, followed by Holm-Sidak multiple comparison. *P< 0.05, ***P< 0.001