Figures & data
Figure 1. Screening results of a library of protein kinase mutant strains of C. albicans during chitosan treatment. (a) Each mutant strain was grown separately in 96-well microplates in RPMI 1640 liquid medium (RPMI), RPMI containing 0.2% acetic acid or RPMI containing both 0.2% acetic acid and chitosan. The optical density of the cells after incubation at 37°C for 48 hr was measured at 600 nm. Each mutant strain treated with acetic acid or chitosan was compared to determine the susceptibility of the strains to chitosan. Statistical significance was evaluated by Student’s t-test (unpaired, two-tailed)., P<0.05; P<0.01. (b) Diagrammatic illustration of the potential signaling cascades and factors involved in chitosan resistance in C. albicans. In addition to the electrostatic interaction between chitosan and the C. albicans cell surface, the intracellular response of several potential pathways and factors could be associated with chitosan. These cascades, such as Hog1, Cek1/Cek2, Mkc1, Ras1-cAMP, and calcineruin pathways and other factors [Citation56], are associated with the cell wall or cell membrane biogenesis, stress tolerance, and mitochondrial function, which are required for chitosan resistance. The functional annotation of each gene is listed in the Table S3 (worksheet 2)
![Figure 1. Screening results of a library of protein kinase mutant strains of C. albicans during chitosan treatment. (a) Each mutant strain was grown separately in 96-well microplates in RPMI 1640 liquid medium (RPMI), RPMI containing 0.2% acetic acid or RPMI containing both 0.2% acetic acid and chitosan. The optical density of the cells after incubation at 37°C for 48 hr was measured at 600 nm. Each mutant strain treated with acetic acid or chitosan was compared to determine the susceptibility of the strains to chitosan. Statistical significance was evaluated by Student’s t-test (unpaired, two-tailed)., P<0.05; P<0.01. (b) Diagrammatic illustration of the potential signaling cascades and factors involved in chitosan resistance in C. albicans. In addition to the electrostatic interaction between chitosan and the C. albicans cell surface, the intracellular response of several potential pathways and factors could be associated with chitosan. These cascades, such as Hog1, Cek1/Cek2, Mkc1, Ras1-cAMP, and calcineruin pathways and other factors [Citation56], are associated with the cell wall or cell membrane biogenesis, stress tolerance, and mitochondrial function, which are required for chitosan resistance. The functional annotation of each gene is listed in the Table S3 (worksheet 2)](/cms/asset/3a6315c9-7c35-4f99-b28a-8f98ebf12e7a/kvir_a_1870082_f0001_oc.jpg)
Figure 2. C. albicans MSS2 mediates chitosan resistance, and its expression is repressed by chitosan. (a) The mss2 null mutant exhibited significant growth defects on medium containing 0.2% chitosan, and complementation restored the resistance to chitosan. A mild growth defect of mss2Δ was observed in the RPMI and buffer control (0.2% acetic acid) groups. (b) Treatment with 0.2% acetic acid for 5, 10 and 20 min did not significantly affect MSS2 expression, whereas SC5314 cells treated with chitosan for each duration exhibited significant reductions in MSS2 expression. The values are presented as the means ± SDs of at least three experimental replicates and were compared with the value for untreated wild-type SC5314 cells. Expression levels were normalized to those of the ACT1 gene. Statistical significance was determined using Student’s t-test, P < 0.05
Figure 3. MSS2 deletion mutants cannot efficiently utilize glycerol as the sole carbon source and exhibit strikingly impaired respiratory activity. (a) Compared to the wild-type strain, the mss2Δ strains showed growth defects on YPG medium. (b) Mitochondrial respiratory activity in C. albicans cells was assessed by extracellular flux analysis. Mitochondrial respiration was assessed by measuring the OCR after sequential addition of 100 mM TET, 2 μM CCCP, 5 μM FCCP and 2 mM antimycin A. Quantification of respiratory activity under (c) basal and (d) ATP production conditions, with reference to the mitochondrial respiration data obtained in B. (e) The CFUs were similar between the untreated and chitosan-treated WT cells. The results are shown as the average of the values from three independent experiments and are the mean ± SD values. **, P < 0.01; ***, P < 0.001
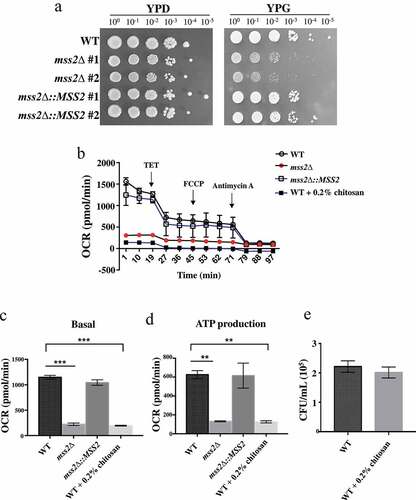
Figure 4. MSS2 deletion enhances resistance to calcofluor white and sensitivity to SDS. The mss2Δ strains did not exhibit changes in caspofungin sensitivity but showed increased resistance to the cell wall-perturbing agent calcofluor white and impaired growth on medium containing SDS
Figure 5. Mss2δ mutant strains exhibit a significantly impaired invasive growth ability on solid agar. (a) MSS2 is not involved in hyphal formation in YPD + serum and RPMI 1640 liquid media. (b) MSS2 deletion strains of C. albicans show severe defects in invasive growth on semisolid RPMI 1640 agar. (c) Quantitative analysis of the invasion assays of HeLa cells shows that the presence of MSS2 in C. albicans is able to reinforce the invasion of HeLa epithelial cells. Values are the mean ± SD from three replicates. *, P < 0.05. (d) Representative images of C. albicans hyphae-invaded HeLa cells. Extracellular hyphae were stained with Concanvalin A (red), whereas both extra- and intracellular hyphae were stained with calcofluor white (blue) after the cell membranes of HeLa cells were permeabilized with Triton X-100. The arrows show hyphae invasion. Scale bar: 10 μm
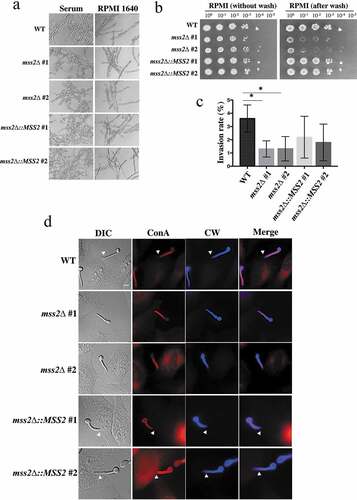
Figure 6. MSS2 deletion strains cannot form robust biofilms. The results of biofilm assays with the C. albicans wild-type, mss2Δ and complemented strains on silicone squares showed that the MSS2 gene is necessary for biofilm development. The presented values are the means ± SDs of the values from three independent experiments with three replicates each. **, P< 0.01
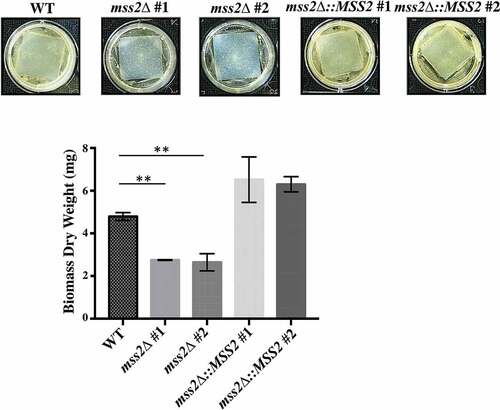
Figure 7. Mss2 positively regulates TEC1 and NDT80 expression during biofilm formation. (a) Loss of any one of the biofilm genes did not affect MSS2 expression, whereas (b) the expression of TEC1 and NDT80 was significantly reduced in the mss2Δ strain. *, P< 0.05
Figure 8. MSS2 deletion strains exhibit reduced virulence and result in lower fungal burdens. (a) Survival curves of mice after infection with 5 × 10⁵ C. albicans cells revealed that mss2Δ is involved in pathogenicity. The fungal burden in the kidney (b) and spleen (c) in four mice per strain was measured on day 3 post infection with C. albicans. *, P< 0.05; **, P< 0.01