
Figures & data
Table 1. LAC S. aureus strains used in this study
Table 2. UAMS-1 S. aureus strains used in this study
Table 3. Primers used for constructing mutants
Figure 1. Relative virulence of S. aureus regulatory mutants in acute sepsis. Top: Kaplan-Meier survival curves are shown for the USA200 strain UAMS-1 and the indicated isogenic mutants. Numbers in parenthesis indicate p values for each mutant by comparison to the results observed with LAC. NS = not significant. Bottom: The number of colony-forming units (CFU) in the spleen, kidney, and heart are shown by scatter plot. Asterisks above each plot statistically significant values by comparison to the parent strain UAMS-1 (U1). Error bars indicate standard error of the mean of log10 transformed values. Asterisk indicates statistical significance relative to the parent strain. NS = not significant
Figure 2. Impact of regulatory mutations on protease production in UAMS-1. Top: Total protease activity in conditioned medium (CM) was assessed with UAMS-1 (U1) and the indicated regulatory mutants using a commercially available casein-based FRET assay (left) or a gelatin-based FRET assay (right). Results obtained with U1 with each protease substrate were averaged and set to a value of 1.0. Results observed with all other strains are shown relative to this value. Bar charts are representative of results from at least two biological replicates for each of which included three experimental replicates. Results for each mutant are reported as mean fluorescence values (MFIs) ± the standard error of the means. Asterisks indicates statistical significance relative to the parent strain. NS = not significant. Middle: Abundance of extracellular protein A (eSpa) and the alternative forms of Nuc1 (NucA and NucB) as assessed by western blot. Bottom: SDS-PAGE profiles of CM from UAMS-1 and the indicated isogenic regulatory mutants
Figure 3. Impact of regulatory mutations on biofilm formation in UAMS-1. The relative capacity of UAMS-1 (U1) and its isogenic regulatory mutants to form a biofilm was assessed using a microtiter plate assay. Bottom image is a representative assay. Upper bar graph indicates cumulative absorbance values obtained from three biological replicates. Error bars indicate standard error of the mean. Asterisk indicates statistical significance (p ≤ 0.05) relative to the isogenic parent strain
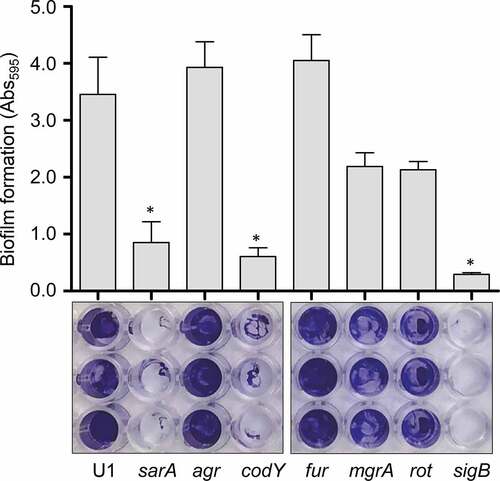
Figure 4. Impact of extracellular proteases in UAMS-1. Top left: Abundance of extracellular protein A (eSpa) was assessed by western blot using conditioned medium (CM) and an anti-Spa monoclonal antibody. Strains included were UAMS-1 (U1, a protease-deficient derivative of U1 (p), isogenic sarA (SA), codY (c), rot (r), and sigB (SB) mutants, and protease-deficient derivatives of each regulatory mutant (SAP, CP, and SBP, respectively). Purified protein A (Spa) and CM from a protein A mutant (spa) were included as positive and negative controls, respectively. Middle left: Abundance of extracellular nuclease (Nuc1) was assessed by western blot in the same strains. CM from a nuclease mutant (nuc) was included as a negative control. Bottom left: SDS-PAGE analysis of CM from the same S. aureus strains. MW: Molecular size markers. Right: The relative capacity of the same strains to form a biofilm was assessed using a microtiter plate assay. Graph indicates cumulative absorbance values obtained from three biological replicates. Error bars indicate standard error of the mean. Single asterisk indicates statistical significance relative to the isogenic parent strain. Double asterisks indicate significance relative to the isogenic regulatory mutant
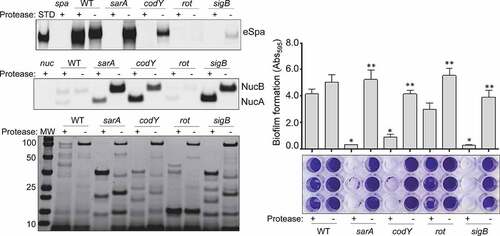
Figure 5. Impact of extracellular proteases in LAC. Top left: Abundance of extracellular protein A (eSpa) was assessed by western blot using conditioned medium (CM) and an anti-Spa monoclonal antibody. Strains included were LAC, a protease-deficient derivative of LAC (p), isogenic sarA (SA), codY (c), rot (r), and sigB (SB) mutants, and protease-deficient derivatives of each regulatory mutant (SAP, CP, RP and SBP, respectively). Purified protein A (Spa) and CM from a protein A mutant (spa) were included as positive and negative controls, respectively. Middle left: Abundance of extracellular nuclease (Nuc1) was assessed by western blot in the same strains. CM from a nuclease mutant (nuc) was included as a negative control. Bottom left: SDS-PAGE analysis of CM from the same S. aureus strains. MW: Molecular size markers. Right: The relative capacity of the same strains to form a biofilm was assessed using a microtiter plate assay. Graph indicates cumulative absorbance values obtained from three biological replicates. Error bars indicate standard error of the mean. Single asterisk indicates statistical significance relative to the isogenic parent strain. Double asterisks indicate significance relative to the isogenic regulatory mutant
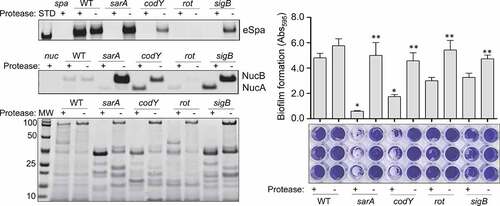
Figure 6. Impact of rot on protease production in LAC and UAMS-1. Total protease activity was assessed with LAC, UAMS-1, and their isogenic rot mutants using conditioned medium (CM) harvested at the early exponential (EE), post-exponential (PE) and stationary growth phases (ST). Protease activity was assessed using a commercially available gelatin-based FRET assay. Bar charts are representative of results from at least two biological replicates for each of which included three experimental replicates. Results are reported as mean fluorescence values (MFIs) ± the standard error of the means. Asterisk indicates statistical significance by comparison to the isogenic parent strain at the same growth phase. Double asterisks indicate statistical significance by comparison to the corresponding UAMS-1 rot mutant at the same growth phase
Figure 7. Impact of protease production on virulence in UAMS-1. A murine sepsis model was used to assess the relative virulence of UAMS-1, its sarA, codY, rot, and sigB mutants, and derivatives of each of these mutants unable to produce any extracellular protease (sarAP, codYP, rotP, and sigBP, respectively). Numbers indicate P values relative to the UAMS-1 parent strain. NS indicates no statistical significance by comparison to UAMS-1
Figure 8. Impact of protease production on virulence in LAC. A murine sepsis model was used to assess the relative virulence of LAC, its sarA, codY, rot, and sigB mutants, and derivatives of each of these mutants unable to produce any extracellular protease (sarAP, codYP, rotP, and sigBP, respectively). Numbers indicate P values relative to the LAC parent strain. NS indicates no statistical significance by comparison to LAC
Figure 9. Impact of regulatory mutations on PIA and capsule production. Top: PIA production was assessed by dot blot using antibodies specific for PIA as previously described [Citation41]. An ica mutant was included as a negative control. Bottom: Capsule production was assessed by dot blot after serial dilution using antibodies specific for type-8 capsular polysaccharide as previously described [Citation42]. A cap mutant was included as a negative control
![Figure 9. Impact of regulatory mutations on PIA and capsule production. Top: PIA production was assessed by dot blot using antibodies specific for PIA as previously described [Citation41]. An ica mutant was included as a negative control. Bottom: Capsule production was assessed by dot blot after serial dilution using antibodies specific for type-8 capsular polysaccharide as previously described [Citation42]. A cap mutant was included as a negative control](/cms/asset/9f19bb9d-1803-49e4-af17-3272e611dc89/kvir_a_1879550_f0009_b.gif)