Figures & data
Figure 1. Structural modeling, expression, replication kinetics and cell-to-cell spread. Potential glycosylation sites are shown in blue, the CS is shown in red and threonine (TR/G) in the CS is in yellow. The model was generated by SWISS MODEL using the HA protein of H4N2 and further edited by Geneious. 2NYT4 was not found in the predicted PDB-3D structure, which starts from position 5 (a). Western Blot of HA after infection of MDCK cells with (+) or without (-) treatment with PNGase F in the presence of exogenous trypsin “T”. NC refers to negative control; naïve cells without infection (b). Replication kinetics in CEK cells at indicated time points after infection in the presence (T+) or absence (T-) of trypsin. Titration was done in MDCKII cells and the results are shown as mean ± standard deviation Log10 PFU/ml. Asterisks indicate significant differences at P < 0.05 of rgH4N2 compared to deglycosylated variants with or without exogenous trypsin (c). Cell-to-cell spread (d) was assessed by measuring 50 plaques in MDCKII with or without the addition of exogenous trypsin. Results expressed as mean and standard deviation relative to plaque size of rgH4N2 in the absence of trypsin. Asterisks indicate significant differences at P < 0.05 of rgH4N2 compared to deglycosylated variants with (red asterisk) or without trypsin (blue asterisk) and among each virus with or without the exogenous protease (black asterisk). ns = not significant compared to rgH4N2 with or without trypsin (D). Asterisks indicate significant differences at P < 0.05 of rgH4N2 compared to deglycosylated variants
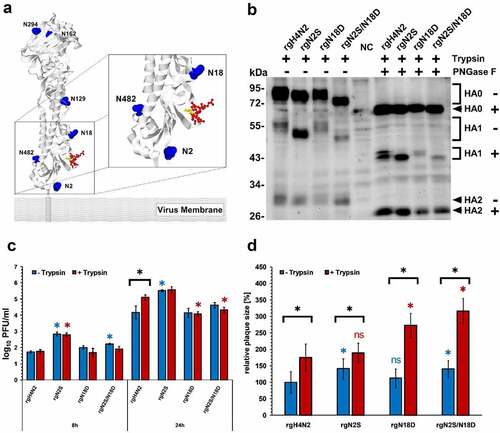
Figure 2. Impact of deglycosylation on replication, thermostability and receptor binding affinity. Multicycle replication in the cells and supernatant 24 hour post infection (hpi) of MDCK, MDCK-HAT and MDCK-TMPRSS2 cells. Asterisks indicate significant differences at P < 0.05 of rgH4N2 compared to deglycosylated variants (a). Heat stability at 50°C after indicated time points of all rgH4N2 variants considered in this study were tested based on HA (b) or PFU (c) titers. Asterisks indicate significant difference at P value < 0.05 of rgH4N2 compared to deglycosylated variants. Receptor binding assay after adjustment of the viruses to HA titers (d) was performed in 4 replicates to identify the affinity to the avian α2,3-linked sialic acid receptors. Avian H5N1/R65 and human H3N2 virus were used as positive and negative control, respectively
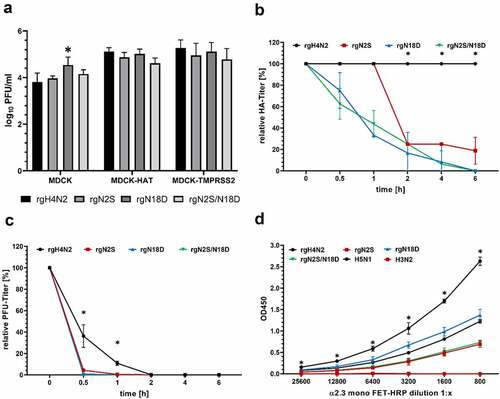
Figure 3. Impact of deglycosylation to trigger fusion at different pH values. Fluorescence microscopy of syncytia formation in QM-9 cells after expression of HA of rgH4N2 and HA carrying N2S, N18D or N2S/N18D as well as GFP, and activation at pH of 4.0, 5.0 and 5.8. Bars = 100 µm. Syncytia were measured and the average area and standard deviation for each virus is shown. Asterisks indicate significance difference at p < 0.05
Figure 4. Distribution of avian influenza virus matrix protein (M1) in selected organs of chicken embryos. Distribution of influenza M1 protein in the indicated organs of embryos inoculated with different viruses. 14-day-old embryonated chicken eggs were inoculated via the allantoic sac for 5 days then embryos were subjected to immunohistochemistry using primary anti-matrix antibody for antigen detection. Labeling by 3-amino-9-ethyl-carbazol (red-brown); hematoxylin counterstain (blue). Bars = 50 µm
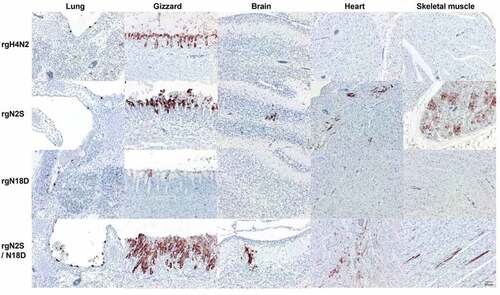
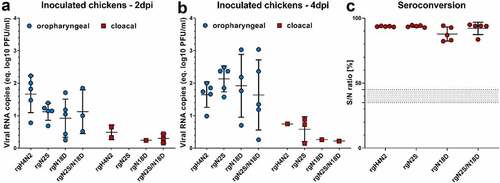
Figure 5. Virus excretion in oropharyngeal and cloacal swabs and seroconversion after intranasal inoculation of chickens. Virus excretion in oropharyngeal and cloacal swabs collected at 2 (a) and 4 (b) dpi in inoculated chickens was determined by RT-qPCR targeting the M gene. Results are shown as viral RNA copies (equivalent log10 PFU/ml) with average ± standard deviation. Anti-NP antibodies were determined by inhibition ELISA in serum samples collected from all chickens at the end of the experiment (c). Shown are the average S/N ratio and standard deviation of positive samples