Figures & data
Table 1. The summarized viral titers after secondary pathogen infection
Figure 1. Virus release from porcine primary tracheal epithelial cells (PTECs) infected by swine influenza virus, followed at intervals of 0, 3, or 7 days by porcine respiratory coronavirus (PRCoV). PTECs were first infected with 4 × 10⁴ FFU of SIV followed by infection with 1 × 10³ FFU PRCoV 0, 3, or 7 days later. Control PTECs were infected with SIV or PRCoV only. Viruses released from the apical side were harvested at different time points and titrated by focus-forming assay in ST cells and MDCK cells, respectively. The dashed lines indicate detection limits for the assays. The results are shown as means ± SEM and significance. a, b significant differences between groups are indicated with different letters (** p < 0.01, *** p < 0.001)
Figure 2. The correlation of PRCoV susceptibility and ciliated cell effected by the prior infection by SIV. (a) PTECs were infected by SIV followed at intervals of 0, 3, or 7 days by PRCoV. The cells were fixed at 1 or 4 days post-infection by PRCoV to determine the loss of cilia after SIV infection. Red: influenza nucleoprotein, Green: CoV nucleocapsid, Red: ciliated cells, (b) Detrimental effect on PTECs. The average coverage of ciliated cells was determined by using ImageJ and shown in bar chart; mock-infected group was normalized to 100%. The results are shown as means ± SEM and significance. a, b significant differences between groups are indicated with different letters (** p < 0.01, *** p < 0.001)
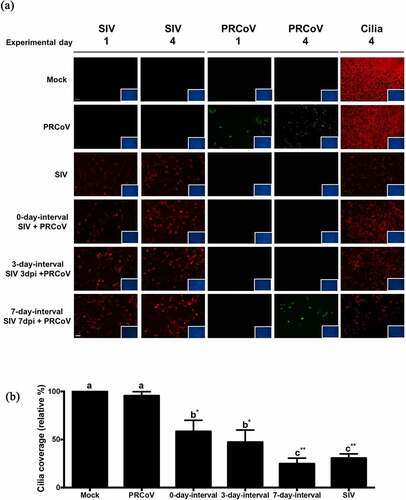
Figure 3. The expression of pAPN on PTECs after infection by SIV. (a) PTECs were apically infected with SIV or mock-infected. The cells were fixed at 7 or 3 days post-infection to determine the expression of pAPN by immunofluorescent staining. Red: ciliated cells, Green: pAPN, Blue: nuclei. (b) To quantify the expression of pAPN, the areas containing green fluorescent were determined by ImageJ. Statistical analysis was performed by one-way ANOVA and followed by Tukey’s multiple comparisons test. The results are shown as means ± SEM and significance. a, b significant differences between groups are indicated with different letters (* p < 0.05)
Figure 4. Innate immune response in PTECs after SIV infection and consequence for PRCoV replication. (a) The relative quantity of IFNβ, ISG15, and MX1 genes on PTECs after SIV infection or Poly (I:C) pretreatment. PTECs were infected or Poly (I:C) pretreated for 2 h from the apical surface. At 24 h post-infection, the messenger RNA from each group was used to perform quantitative real-time PCR. IFNβ, Mx1, and ISG15 genes were normalized to β-actin expression. The calculation of 2− ΔΔCT method was normalized to mock-infected groups. (b) Effect of Poly (I:C) on PRCoV. With or without one-day Poly (I:C) pretreatment, PTECs were infected by PRCoV. The results were shown as means ± SEM determined. a, b, c significant differences between groups are indicated with different letters (* p < 0.05, ** p < 0.01 or *** p < 0.001)
Figure 5. Virus release from PTECs infected with PRCoV followed by infection with SIV. PTECs were infected with 1 × 10³ FFU PRCoV followed by infection with 4 × 10⁴ FFU of SIV three days later. Control PTECs were infected with SIV or PRCoV only. Viruses released from the apical side were harvested at different time points and titrated by focus-forming assay in ST cells and MDCK cells, respectively. The dashed lines indicate detection limits for the assays. The results are shown as means ± SEM and significance. a, b significant differences between groups are indicated with different letters (* p < 0.05 and** p < 0.01)