Figures & data
Table 1. Antifungal susceptibility testing of C. auris strains BJCA001 and BJCA002
Figure 1. Phylogenic analysis of two strains isolated from Beijing, China and representative isolates of major clades of C. auris. The two strains (BJCA001 and BJCA002) isolated from Beijing are highlighted in bold. The phylogenic tree was generated using the program RAxML v7.3.2 with 381,150 SNPs. The generalized time-reversible (GTR) model, a Gamma distribution, and 1000 bootstraps were used to construct the support of the phylogenetic relationships. Countries from which the isolates originated are indicated in brackets. CHN, China; USA, United States of America; GBR, United Kingdom; JPN, Japan; KOR, Korea (South); SGP, Singapore; ZAF, South Africa; DEU, Germany; PAK, Pakistan; IND, India; RUS, Russia; NLD, Netherlands; IRN, Iran; COL, Colombia; VEN, Venezuela. The scale bar represents the expected number of substitutions per nucleotide position
Figure 2. Colony and cellular morphologies of strains BJCA002 (a) and BJCA001 (b). Yeast-form or filamentous cells of C. auris were plated on YPD medium and incubated at 25°C for 7 days. Scale bar, 10 μm
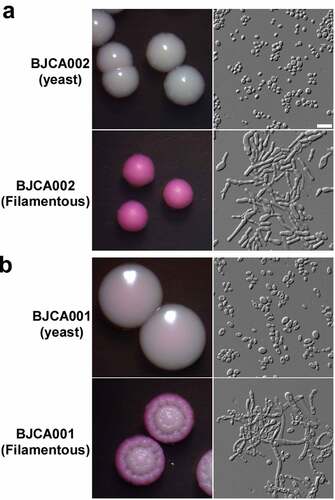
Figure 3. Comparison of SAP activities of C. auris strains BJCA001 and BJCA002. Approximately 5 × 10⁶ yeast-form cells of BJCA002 (a) or BJCA001 (b) in 5 μL ddH2O were spotted onto YCB-BSA medium plates and then incubated at 25°C, 30°C, or 37°C for 7 days. The width of the white precipitation zones (halos) that indicate the level of SAP-mediated BSA hydrolysis activity are shown below the corresponding image (mm). Average values and standard deviations are presented (three repeats). Scale bar, 10 μm
Figure 4. Virulence of C. auris strains BJCA001 and BJCA002 in a G. mellonella infection model. Yeast-form cells of C. auris were used. Approximately 1 × 10⁶ C. auris cells of each strain were injected into each larva of G. mellonella. Ten larvae were injected for each strain. (a) Survival curves at 37°C. (b) Survival curves at 25°C
Figure 5. Virulence of C. auris strains BJCA001 and BJCA002 in a mouse systemic infection model. Fungal burden assays were performed. Five mice were used for infection of each strain. Each mouse was injected with approximately 2 × 10⁷ fungal cells via the tail vein. Mice were killed for CFU assays at 24 h post-infection. *Indicates a significant difference (P value < 0.01, Student’s t-test, two-tailed)
Table 2. Genome assembly information of strains BJCA001 and BJCA002
Figure 6. Whole genome synteny and divergence. (a) Genome synteny between C. auris strains BJCA001 and BJCA002. Black blocks indicate shared syntenic regions of the two genomes, whereas gray blocks indicate large fragment recombination regions. Percentages of divergence for the two genomes and each corresponding pairs of chromosomes are also shown. Every point stands for the SNP density of a 5-kb window and 1-kb step size. (b) Examples of the Zorro3 retrotransposon cluster in strain BJCA001
Figure 7. Variation of the copy numbers of the Zorro3 retrotransposon element FGR14 in C. auris isolates of the four major clades. Each dot denotes an isolate, and 545 strains were analyzed. The genomic sequences used for analysis were from the NCBI database
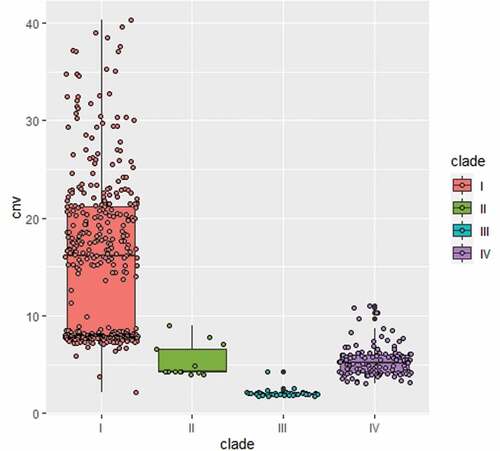
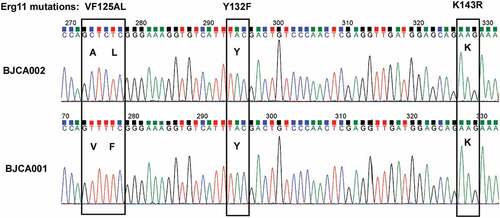
Figure 8. Analysis of hot-spot mutations in ERG11. Strain BJCA001 carries no mutations in the three reported hot-spot regions, whereas BJCA002 has a VF125AL mutation (V125A and F126L)