Figures & data
Figure 1. Intrarectal infection of Guinea pigs with the wild type (WT) and ΔyhjC strains. The number of colony-forming units (CFUs) of the WT strains colonizing colon tissues was significantly higher than those of ΔyhjC, and the complementation of yhjC with ΔyhjC restored the ability of mutant Shigella strains to colonize the colon tissues to levels observed with the WT strain. 5 guinea pigs per group were used. Data were obtained from two separate experiments and analyzed using unpaired student’s t-test (*p < 0.05; **p < 0.01; ***p < 0.001)
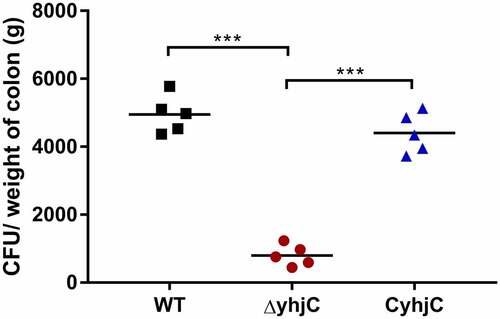
Figure 2. Analysis of the ability of the wild type (WT), ΔyhjC, and complemented Shigella strains to adhere to and invade HeLa cells. Both adhesion and invasion abilities were attenuated in ΔyhjC mutants compared with those observed in the WT, and the complemented strain showed adhesion and invasion abilities similar to the WT. (a) Analysis of adherence ability; (b) analysis of invasion ability. Data were generated from three independent experiments and have been presented as mean ± SD. p-values were determined using unpaired Student’s t-test (*p < 0.05; **p < 0.01; ***p < 0.001)
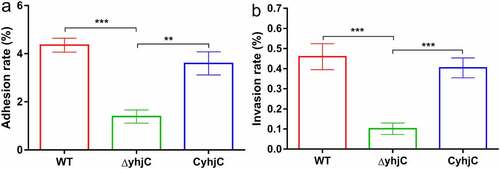
Figure 3. Comparison of the Congo red dye-binding ability of the wild type (WT) and ΔyhjC strains. The WT bacterial colony exhibits increased intensity of red coloration than that observed with ΔyhjC, thereby proving that WT strains are more virulent than yhjC.
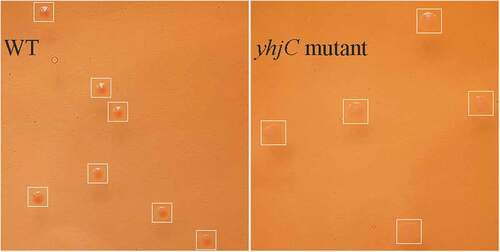
Figure 4. yhjC deletion downregulates the expression of the main virulence genes of Shigella. The expression levels of virF, virB, ipaA, ipaB, ipaC, and mxiE were significantly downregulated in ΔyhjC. Data were generated from triplicate experiments and have been presented as mean ± SD. p-values were determined by using unpaired Student’s t-test (*p < 0.05; **p < 0.01; ***p < 0.001)
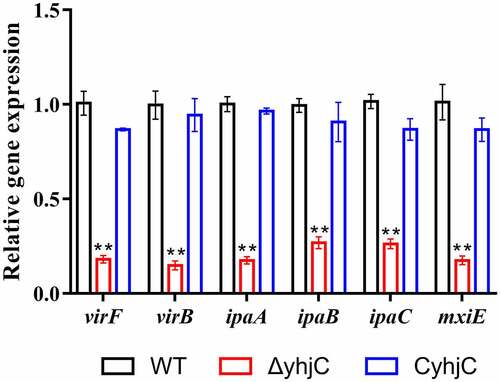
Figure 5. Analysis of the interaction between the purified YhjC-His6 protein and the virF promoter DNA using EMSA. A quantity of 50 ng of DNA and a concentration ranging from 0–50 nM of the purified YhjC-His6 protein were used in each reaction. Less promoter virF fragments exhibited migration with increasing concentrations of the YhjC protein. The DNA of the rpoS promoter was used as a negative control and no binding was observed
Figure 6. RNA sequencing analysis. (a) Transcriptional profiles of T3SS-related genes in the wild type and ΔyhjC Shigella strains. Expression levels of almost all T3SS-related genes were downregulated following yhjC deletion. (b, c) Fold-change in the FPKM of representative differentially expressed genes (DEGs). The fold change in representative DEGs encoding virulence genes is much higher than that observed in non-virulence genes. (d) Verification of the RNA sequencing data through qRT-PCR analysis of non-virulence genes. Changes in the expression of the non-virulence genes are consistent with those of the RNA sequencing data. Data were generated from triplicate experiments. p-values were determined by using multiple t-test and unpaired Student’s t-test (*p < 0.05; **p < 0.01; ***p < 0.001)
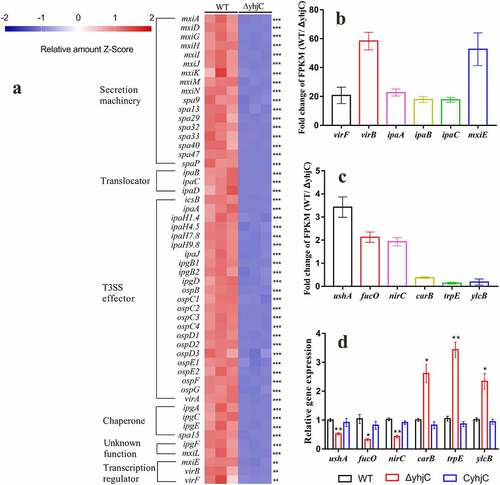
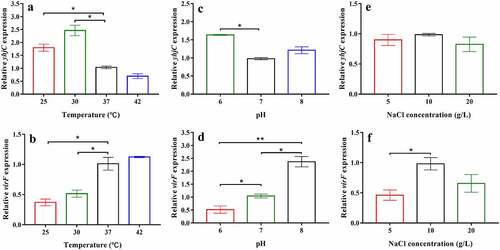
Figure 7. The effects of temperature, pH, and NaCl concentration on the levels of yhjC and virF mRNA. (a, b) Temperature influences the expression of yhjC and virF; (c, d) pH influences the expression of yhjC and virF; (e, f) NaCl concentrations influence the expression of virF but not that of yhjC. The relative gene expression of Shigella at 37 °C, pH 7, or 10 g/L NaCl were set to 1 and used as reference. Data were generated from triplicate experiments and have been presented as mean ± SD. p-values were determined by using unpaired Student’s t-test (*p < 0.05; **p < 0.01; ***p < 0.001)