
Figures & data
Figure 1. SRs are required for Lm uptake by macrophages. (a and b) Chemical saturation of SRs impairs bacterial uptake by macrophages-like cells. (a) Human THP-1, (b) murine Raw and J774 macrophage-like cells were left untreated or pretreated with fucoidan, Poly (I) and its control Poly (C), infected by Lm for 30 min, incubated with gentamicin, washed and lysed to quantify intracellular bacteria. Values are expressed relative to values in non-treated cells, arbitrarily fixed to 100%. Values are mean ± SD of three independent assays. *p < 0.05; **p < 0.01; ***p < 0.001. (C) SR gene expression was assessed by RT-PCR analysis on THP-1, Raw and J774 total RNAs, using HPRT1 as reference gene. Band panel for each cell line is representative of two assays
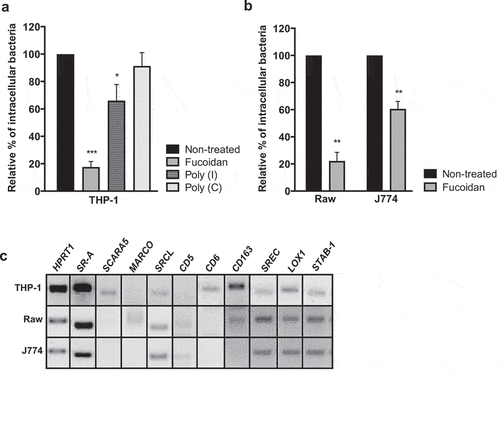
Figure 2. STAB-1 is required for Lm uptake by macrophages. (a) Impact of STAB-1 on Lm adhesion and entry into macrophages. Raw were pre-treated with an anti-IgG (SC-2025) or anti-STAB-1 antibody, at 5 and 25 μg/ml (sc-98,788) before Lm infection. Adherent and intracellular bacteria were quantified. Values are expressed relative to values in IgG-treated cells, arbitrarily fixed to 100%. (b) Quantification of intracellular bacteria (Lm and Li) or beads in WT and STAB-1 KO BMDMs infected for 30 min. Values are expressed relative to WT arbitrarily fixed to 100%. (c) Quantification of the percentage of cells with intracellular Lm and beads and (d) of the number of intracellular Lm or beads in BMDMs upon 30 min of infection. (e) Immunofluorescence images of WT and STAB-1 KO BMDMs infected with Lm-GFP (green) for 30 min. Actin is labeled with TRITC-conjugated phalloidin. Scale bar, 10 μm. Values are mean ± SD of three to four independent experiments. Statistical significance is indicated as compared to WT BMDMs. *p < 0.05; **p < 0.01
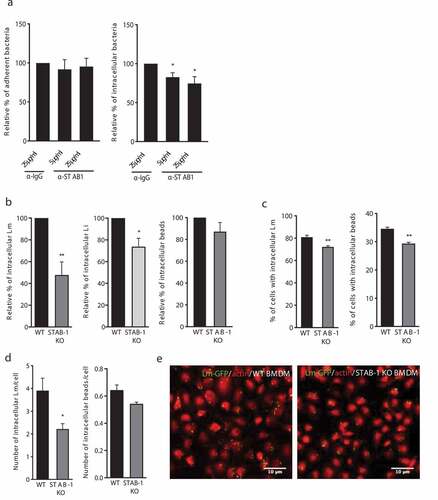
Figure 3. STAB-1 has a protective role against Lm infection. (a) Quantification of viable bacteria in spleens and livers recovered from WT and STAB-1 KO mice, 3 d after intravenous infection with 5 × 10⁵ CFU of Lm. Data are presented as scatter plots, each animal is represented by a dot and the mean is indicated by a horizontal line. (b) WT and STAB-1 KO mice survival after intravenous inoculation of 105 CFU of Lm (n = 5). *p < 0.05
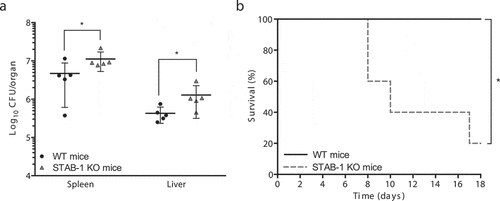
Figure 4. STAB-1 is required for an efficient inflammatory response and immune cell accumulation in Lm-infected spleens. (a) WT and STAB-1 KO mice were intravenously infected with 5 × 10⁵ CFU of Lm. Mice were sacrificed at d 3 post-infection and spleen, liver and serum were collected. Levels of TNF-α, IL-6 and IL-10 were measured by ELISA. Data are represented as an average of ten mice from two independent experiments per group. *p < 0.05; **p < 0.01; ***p < 0.001. (b) Spleen cells from Lm (5 × 10⁵ CFU) infected WT and STAB-1 KO mice were isolated and analyzed by flow cytometry. Total numbers of myeloid cells (CD11bint/hi), neutrophils (CD11bhiLy6GhiCD11C−), dendritic cells (CD11bintCD11chiLy6G−), macrophages (CD11bhiLy6Cint/-Ly6G−CD11clo) and inflammatory monocytes (CD11bhiLy6ChiLy6G− CD11clo) are shown. Data are presented as scatter plots, with each animal represented by a dot and the mean indicated by a horizontal line. *p < 0.05; **p < 0.01. (c) WT and STAB-1 KO mice were intravenously infected with 5 × 10⁵ CFU of Lm. Mice were sacrificed at d 3 post-infection to recover spleens and livers. The expression of chemokines CCL2, CXCL10 and CCL7 was quantified by qRT-PCR. Data are represented as an average of 10 mice from two independent experiments per group. *p < 0.05; **p < 0.01; ***p < 0.001
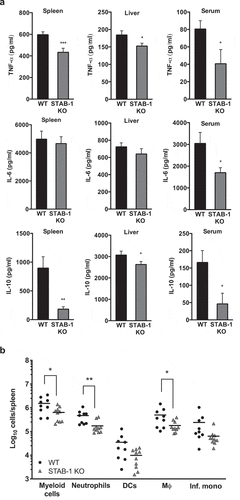
Figure 4. (Continued)
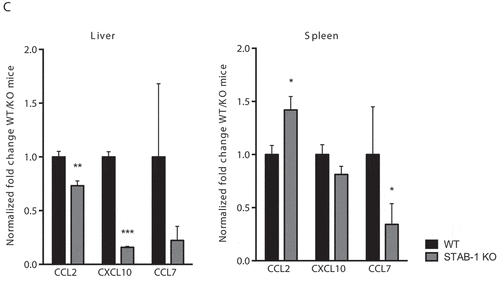
Figure 5. STAB-1 is important for early myeloid cells recruitment in response to Lm infection. (a–d) Single-cell suspensions recovered from the peritoneal cavity of WT and STAB-1 KO mice were analyzed by flow cytometry to evaluate cell populations. (a) Non-infected animals. (b-c) Mice intraperitoneally infected with 105 CFU of Lm for (b) 6 h or (c) 24 h. (d) Mice intraperitoneally injected with purified LTA (5 mg/ml) for 6 h. Data are represented as an average of two independent experiments, with at least six mice per group. *p < 0.05; ***p < 0.001
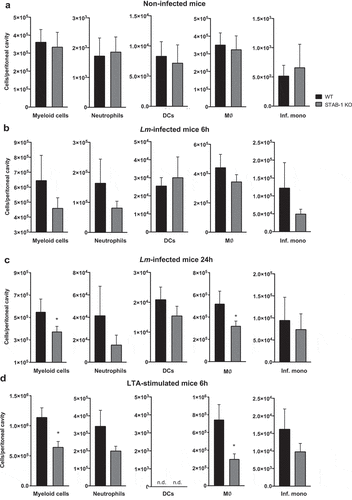
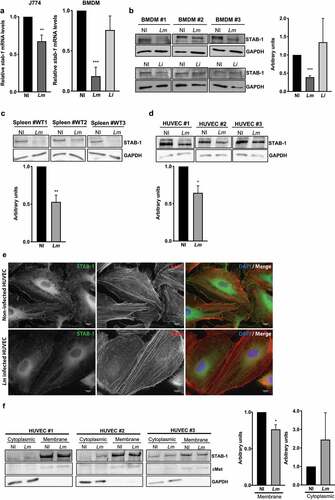
Figure 6. STAB-1 expression is decreased and re-localized in response to Lm infection. (a) Assessment of STAB-1 expression by (A) quantitative RT-PCR and (b) Western Blot. (A) Quantification of STAB-1 mRNA levels on RNAs extracted from J774 and BMDMs infected with Lm for 30 min. STAB-1 expression levels in infected conditions were normalized to those in non-infected BMDMs, arbitrarily fixed to 1. (b–d) Independent immunoblots to detect STAB-1 protein in (B) BMDMs left uninfected (NI) or infected with Lm or Li for 30 min, (c) spleen of NI and Lm-infected mice for 3 d (5 × 10⁵ CFU), (d) NI and Lm-infected HUVECs. Immunoblots quantification of STAB-1 signal intensity in NI and infected conditions, normalized to GAPDH. (e) Immunofluorescence images of NI and Lm infected HUVECs, stained with an anti-STAB-1 antibody. DNA counterstained with DAPI and actin labeled with TRITC-conjugated phalloidin. Scale bar, 10 μm. (f) Immunoblots to detect STAB-1 protein in the cytoplasmic and membrane fractions of NI and Lm-infected HUVECs upon cell fractioning. cMet was used as a membrane loading protein control and GAPDH as a cytoplasmic loading protein control. Immunoblots quantification of STAB-1 signal intensity in NI and infected conditions, normalized to cMet or GAPDH
Supplemental Material
Download Zip (158.3 KB)Data availability statement
The data that support the findings of this study are openly available in “bioRxiv” at https://www.biorxiv.org/content/10.1101/2021.02.23.432451v1