Figures & data
Table 1. Bacillus cereus ATCC 14579 genes targeted in the qPCR analysis classified by function
Table 2. Galleria mellonella genes targeted in the qPCR analysis classified by function
Figure 1. Survival and gut colonization level of Galleria mellonella after oral infection with vegetative Bacillus cereus ATCC 14,579 (WT). A) G. mellonella survival was recorded immediately (T0), 3 hours (T3) and 16 hours (T16) after force-feeding with B. cereus WT + Cry1C toxin or toxin alone. B) B. cereus WT persistence inside the whole G. mellonella gut was measured at T0, T3, and T16. Error bars represent standard deviations of three independent experiments. 40 larvae were force-fed per experiment. For CFU counts a total of 18 larvae (3 x 6 larvae) were analyzed per time point. Statistical differences are annotated. The student t-test was performed using RStudio software (n = 3, p < 0.05)
Figure 2. Light microscope observation of stained cryo-sections of germ free G. mellonella larvae, Sections in (A,B,C,D) are without B. cereus, while E,F,G shows the UV-micro-dissection of bacteria in the Larval lumen 3 hours post force-feeding with B. cereus associated with toxin. (a) a sagittal20 µm thick-section of a whole non-infected larvae. The area inside the red square indicates the part from which cross-sections (16 µm thick) were sampled for laser-capture microdissection. (b, c) Cross-sections from a negative control (PBS force-fed) larvae (d) section from larva T3 hours post force-feeding with Cry1C toxin alone (B,C,D are captured with lens: 10×). The figures E, F and G present cross-sections before (e) and (f) after laser-capture microdissection with UV-cutting (F, lens 10×; G, lens 2×). (lum: Lumen; Hem: Hemocoel; Ct: Cuticle; Mg: Midgut; Amg: Anterior midgut; Pmg: Posterior midgut; gEpi: Gut Epethlium (enterocytes); pm: Peritrophic matrix; bac: Bacteria
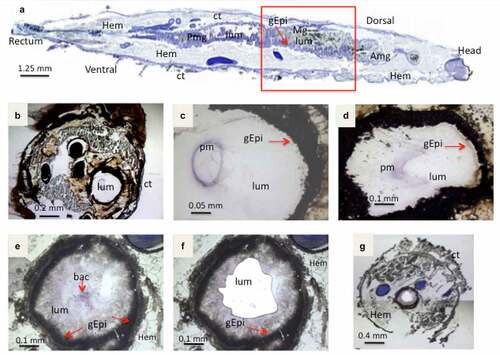
Figure 3. Light microscope observation of G. mellonella larvae infected with B. cereus associated with Cry1C toxin 3 hours after force-feeding. Cross–section (16 µm) with focus on the midgut lumen, and bacterial localization and morphology . The sections were stained with cresyl violet and dehydrated with ethanol and xylene (a). The majority of the bacteria were found in the midgut lumen and the peritropfic matrix has lost its structure. (A) lens 4×; (b) lens 10×; (c) 20× lens, and (d) 40× lens. lum: intestinal lumen; bac: bacteria; gEpi: Gut Epithelium; pm: Peritrophic matrix
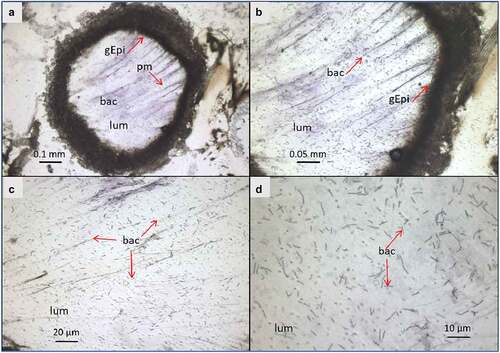
Figure 4. Light microscope observation of G. mellonella larvae infected with B. cereus associated with Cry1C toxin 16 hours after force-feeding. Cross–sections (16 µm) (cresyl violet staining and ethanol and xylene dehydration) with focus on the intestine (midgut). The bacteria appear colored as dark or brighter violet. Different magnifications are shown: (a) 4×; (b)10×; (c) 20×, and (d) 40×. (lum: intestinal lumen; bac: bacteria; gEpi: Gut Epithelium; pm: Peritrophic matrix
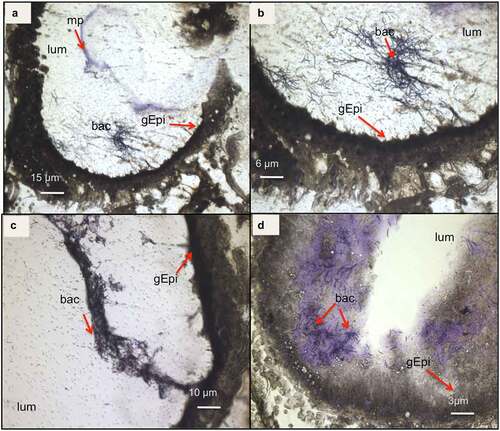
Figure 5. Quality assessment or total RNA (totRNA) samples (Agilent Bioanalyzer). A: totRNA quality of B. cereuscultures; B: totRNA quality of G. mellonella gut infected with B. cereus associated with Cry1C toxin obtained after Laser-Capture Microdissection (LCM) at 3 hours (T3) post force-feeding and 16 hours (T16) post force-feeding. 16S and 23S indicate bacterial ribosomal RNA. 18S and 28S indicate eukaryotic ribosomal RNA
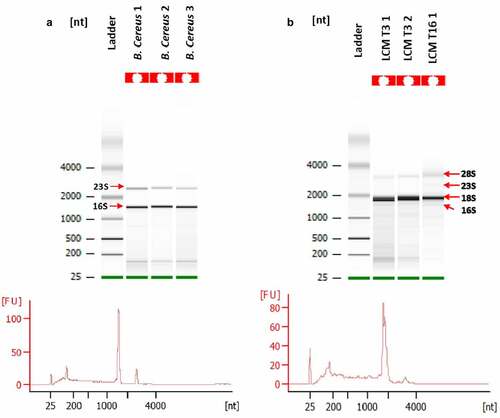
Figure 6. Gene amplification test using two different quantities of cDNA obtained from B. cereus grown in vitro. The cycle threshold (Ct) values are obtained by qPCR for each condition tested are indicated. Difference of Cts (ΔCt) between the control and the pre-amplified (PreAMP) cDNA for each gene and condition are indicated as well. 50 or 0.05 pg: the quantity of cDNA tested in control samples (without pre-amplification); 50 or 0.05 pg PreAMP: the quantity of cDNA tested from PreAMP samples. Each gene exhibits about an 11 Ct gain when preamplified for each quantity tested. Results were obtained from three independent LB cultures and each qPCR analysis was performed with three technical replicates per sample
Figure 7. Differential (ΔΔCt) gene expression of B. cereus ATCC 14,579 associated with Cry1C toxin collected at late infection stage (16 hours) compared to early stage (3 hours) post force-feeding in the midgut of germ-free G. mellonella. mRNA extractions were from LCM sections obtained at the two time points. Data are normalized using 3 housekeeping genes (rpoB, tpi, and purH). Error bars indicate the standard deviation of three biological replicates. Secreted virulence factors (inha 2 (metalloprotease), nheB (Non hemolytic enterotoxin); hlyII (hemolysin II); Oxidative stress factors : sodA (superoxidasedismutase); catalase (catalase); dps (ferrtiin–like iron binding protein); Regulators : plcR (virulence regulon transcriptional activator); fur (Ferric uptake regulator (often repressor);codY (Transcriptional repressor). Iron homeostasis factors: isdC (Heme associated transport protein), ilsA (iron regulated leucine–rich protein), feoB (Ferrous iron transport protein); fec (Iron III) dicitrate ABC transporter); fpuA (petrobactin siderophore binding protein); fatB (petrobactin siderophore binding protein); asb (gene from the petrobactin siderophore synthesis locus); feuA (bacillibactin siderophore binding protein); entA (gene from bacillibactin siderophore synthesis locus)
Figure 8. Differential gene expression (ΔΔCt) of two iron related G. mellonella genes. Genes encoding ferritin and transferrin obtained from mRNA at late infection stage (16 hours) compared to early stage (3 hours) in germ-free G. mellonella midgut infected with B. cereus associated with Cry1C toxin. Error bars indicate the standard deviation of three biological replicates