
Figures & data
Figure 1. Identification of a small animal model for SARS-CoV-2 infection representing most clinical features of COVID-19. (a, b) The photographic image of adult female (a) and male (b) Roborovski hamster SH101, a laboratory inbred strain. (c, d) The body weight changes for 2-month-old female (c) and male (d) Roborovski SH101 post-infection of SARS-CoV-2. The body weights were measured daily for 5 days (up to 4 dpi) (n = 6). Data are presented as mean ± SD. The statistical significances are marked on the graphs as * P < 0.05 and ** P < 0.01. (e) The photographic images of the dissected lungs of the SARS-CoV-2-infected hamster with right-predominant pneumonia indicated as white dotted circles
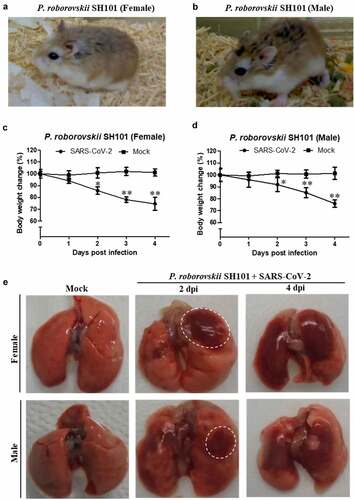
Figure 2. The body temperature changes of Roborovski SH101 hamster infected with SARS-CoV-2. (a, b) The representative infrared thermographic images of the 2-month-old female (a) and male (b) P. roborovskii SH101 for 0, 1, 2, 3 days post-infection (dpi) of SARS-CoV-2. (c, d) The body surface temperatures on the chest, as close as possible to the lung, of the 2-month-old female (c) and male (d) P. roborovskii SH101 hamster infected with SARS-CoV-2 (n = 6). The body temperatures were measured by selecting the highest temperature spot on the thermal images and are presented as mean ± SD. The statistical significances are marked on the graphs as * P < 0.05 and ** P < 0.01
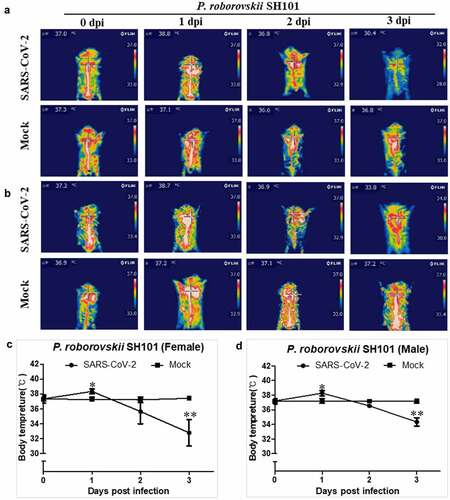
Figure 3. Thrombosis and viral replication in Roborovski SH101 hamster infected with SARS-CoV-2. (a, b) The levels of fibrin degradation products (FDP) in the plasma of the female (a) and male (b) P. roborovskii SH101 hamsters at 2 and 4 dpi of SARS-CoV-2 (n = 3). (c, d) The levels of D-dimer in the plasma of the female (c) and male (d) P. roborovskii SH101 hamsters at 2 and 4 dpi of SARS-CoV-2 (n = 3). (e, f) The viral RNA levels in the lung, brain, stomach, intestine, trachea, liver, blood, heart, kidney, and spleen of the female (e) and male (f) P. roborovskii SH101 hamsters measured by RT-qPCR at 2 and 4 dpi of SARS-CoV-2. Data are presented as mean ± SD (n = 3). The statistical significances are marked on the graphs as * P < 0.05 and ** P < 0.01
Figure 4. Histological examination of Roborovski SH101 hamster infected with SARS-CoV-2. In section images, green box area is enlarged again and shown at the top right black box. (a) The representative images of the H&E and IHC of the lungs of 2-month-old P. roborovski SH101 at 2 and 4 dpi of SARS-CoV-2. Multifocal interstitial pneumonia with thickened alveolar septa (yellow arrows) and infiltration of fibrin and mononuclear cells (black arrows) are indicated. Hyaline membrane is also observed at 2dpi (red arrows). SARS-CoV-2 antigen expression is colocalized with areas of peribronchial and alveolar epithelial cells as shown in IHC for SARS-CoV-2-nucleocapsid (400 ×). (b) The representative images of the H&E and IHC of the livers of 2-month-old P. roborovski SH101 at 2 and 4 dpi of SARS-CoV-2 showing pathologies. Focal and intraportal lymphoid cell aggregation and multifocal fatty changes are indicated by red and black arrows, respectively. SARS-CoV-2 antigen expression is colocalized in few liver cells as shown in IHC for SARS-CoV-2-nucleocapsid (100 ×). (c) The representative images of the H&E and IHC of the brains of 2-month-old P. roborovski SH101 showing pathologies at 2 and 4 dpi. Subarachnoid hemorrhage and lymphocyte focal infiltration are indicated by red and black arrows, respectively. SARS-CoV-2 antigen expression is colocalized in few subarachnoid as shown in IHC sections for SARS-CoV-2-nucleocapsid (100 ×). The scale bars represent 100 μm for 100 × and 20 μm for 400 ×
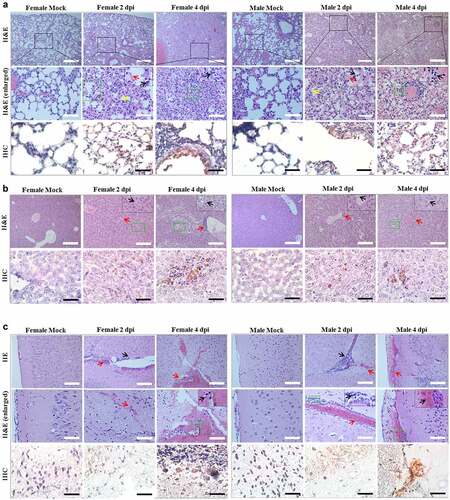
Figure 5. The body temperature changes of the hACE-transgenic mice and Syrian golden hamsters after infection of SARS-CoV-2. (a, b) The representative infrared thermographic images of the 2-month-old male hACE-transgenic mice (a) and 3-month-old male Syrian golden hamsters (b) at the indicated dpi of SARS-CoV-2. (c, d) The body temperatures on the chest, as close as possible to the lung, of the male hACE transgenic mice (c) and male Syrian golden hamster (d) at the indicated dpi (n = 6). The body temperatures were measured by selecting the highest temperature spot on the thermal images and are presented as mean ± SD
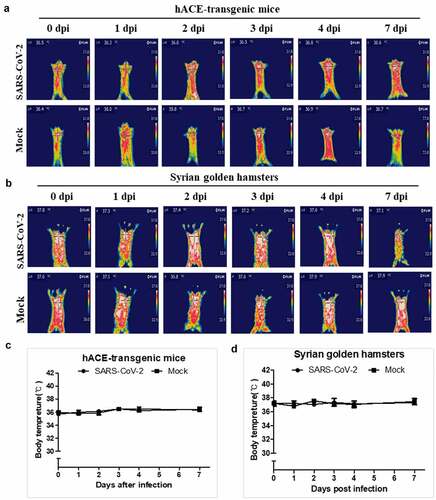
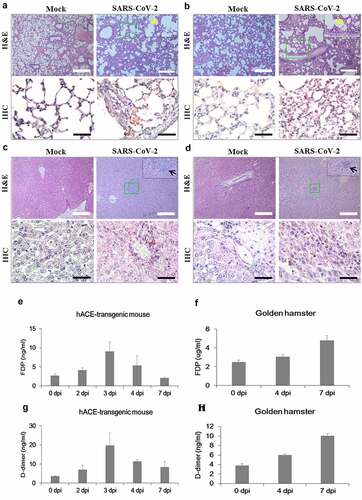
Figure 6. Histological examination, thrombosis, and viral replication in the hACE-transgenic mice and Syrian golden hamsters infected with SARS-CoV-2. (a-d) The representative images of the H&E and the IHC sections of the lungs (a, b) and the livers (c, d) of the 2-month-old hACE-transgenic mice (a, c) and 3-month-old Syrian golden hamsters (b, d) at 7 dpi of SARS-CoV-2 showing pathologies. Multifocal interstitial pneumonia with thickened alveolar septa (yellow arrows) and lymphoid cell aggregation (black arrows) are indicated in H&E staining. SARS-CoV-2 antigen expression is detected in the lung and liver in IHC for SARS-CoV-2-nucleocapsid (400 ×). (e, f) The levels of fibrin degradation products (FDP) in the plasma of the 2-month-old hACE-transgenic mice (e) and 3-month-old Syrian golden hamsters (f) at the indicated dpi (n = 3). (g, h) The levels of D-dimer in the plasma of the hACE-transgenic mice (E) and Syrian golden hamsters (F) after infection (n = 3). (i, j) The viral RNA levels in the primary organs, lung, brain, stomach, intestine, trachea, liver, blood, heart, kidney, and spleen, of the male hACE-transgenic mice (i) and the male Syrian golden hamsters (j) measured by RT-qPCR at the indicated dpi of SARS-CoV-2. Data are present as mean ± SD (n = 3). The scale bars represent 100 μm for 100 × magnifications
Supplemental Material
Download MS Word (3.7 MB)Data availability statement
The data that supplementary video the findings of this study are openly available in “figshare” at https://figshare.com/s/448f2198b5db48402fd0, https://figshare.com/s/3bb52d39a33c1b3c72d2, https://figshare.com/s/0c1b7ba6329a6f9fc1df and https://figshare.com/s/40689f34114dc42f4dba.