
Figures & data
Table 1. Strains used in this study
Table 2. Primers used in this study
Figure 1. Western blot analysis of four different CS6+ ETEC strains. Expression of CS6 was determined by western blot analysis of whole cell lysates. Strains 203740, 204576, and E17018A were categorized as Group 2 ETEC strains and share the same CS6 operon structure. 214–4 was categorized as Group 1 and is distinct in sequence from Group 2 strains. Protein (CS6) amounts were quantified by densitometric analysis based on the single CS6 purified protein standard (lane 7) and the negative control 1208S (lane 2) which is an attenuated Shigella flexneri strain
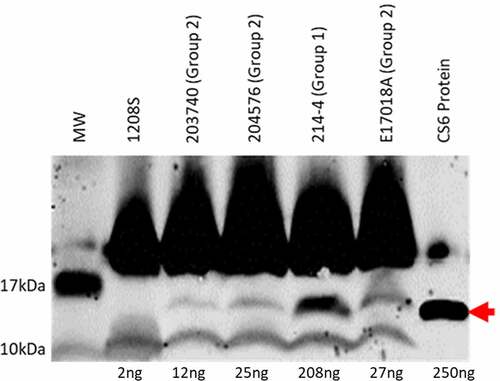
Figure 2. CS6 operon structures. a) Organization of the CS6 operon demonstrating the stem-loop structure the intergenic region between cssB and cssC. b) The sequence of the stem-loop structure denoting 4-bp smaller loop structure in Group 1 CS6 compared to Group 2 CS6. c) In Group 1 CS6, the final gene in the operon, cssD, is truncated by 24bp compared to Group 2 CS6 and exhibits no identifiable downstream sequence homology. d) Schematic display of the seven recombinant CS6 operons. CS6WT1 and CS6WT2 are found in WT-ETEC strains. CS6H1 and CS6H2 were engineered as hybrids and were not observed in any WT strains. In CS6M1, one half of the palindromic sequence was mutated such that the hairpin structure does not form. CS6M2 does not contain any intergenic region between cssB and cssC. CS6M3 acquired two deletions in the palindromic sequence during PCR amplification and forms a shorter stem comprised of 4 bases rather than the typical 6–7
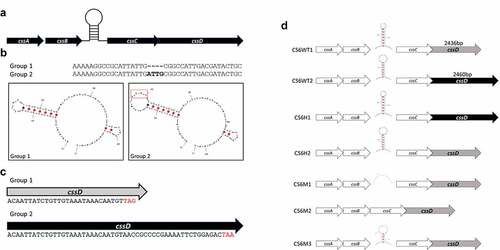
Table 3. Distribution of CS6 operon motifs in geographically diverse CS6 ETEC isolates
Figure 3. CS6 expression. Expression of CS6 from the recombinant operons expressed in DH5α was determined by western blot analysis of whole cell lysates. Proteins (CS6) were quantified by densitometry based on the single CS6 protein standard (lane 3) and the negative control pGRG-mLpp. CS6M1, CS6M2, and CS6M3 were run on a separate blot with a single CS6 protein standard used for densitometric analysis
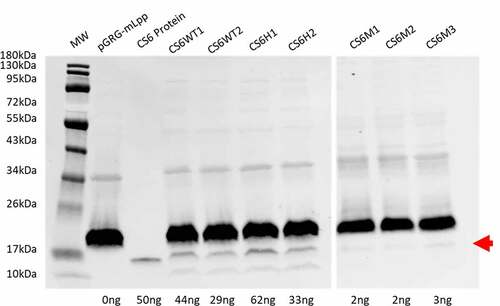
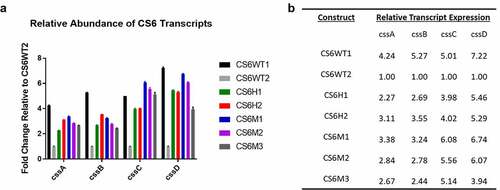
Figure 4. A) RT-qPCR analysis of CS6 transcript abundance compared to CS6WT2. Strains were grown to OD600 0.5 in LB broth and harvested to isolate total RNA. b) Relative fold change values of CS6 transcripts in each recombinant CS6 strain
Supplemental Material
Download (175.2 KB)Data availability statement
Supporting sequence data of ETEC strains utilized in this study are available online through GenBank at https://www.ncbi.nlm.nih.gov/nuccore/?linkname=pubmed_nuccore&from_uid=30944874 [Citation28].