Figures & data
Figure 1. Growth characteristics and morphology of GAS WT and prsA deletion mutants. The overnight-grown GAS WT and ΔprsA mutants generated in the M1 strain A20 (a) or M4 strain 4063–05 (b) were diluted with fresh THY to OD600 of 0.1. Aliquots were taken every 30 min and the optical density was read with a spectrophotometer at 600 nm. Data shown were mean ± SD pooled from two independent experiments. Statistical significance was determined in comparison to WT by unpaired t test. Bright-field imaging of stationary phase M1 WT and its prsA deletion derivatives (c) and M4 WT and its prsA deletion derivatives (d). To determine bacterial chain lengths, 60 chains were randomly selected and counted. Statistical significance was determined in comparison to WT by one-way ANOVA multiple comparison test. *, P< 0.05; **, P< 0.01; ***, P< 0.001; ****, P< 0.0001
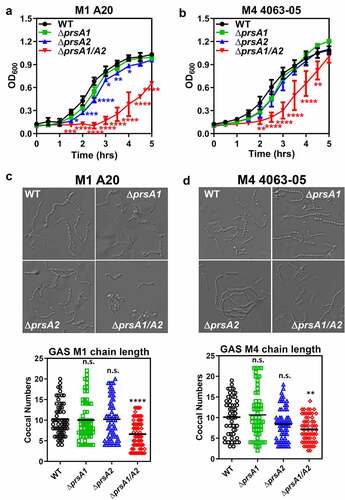
Figure 2. Quantitative proteomic analysis of M4 GAS WT and prsA deletion mutant. SDS-PAGE and silver stain analysis of M4 GAS proteins collected from cell-free culture media (a), extracellular vesicles (b) and crude membrane extracts (c). Differentially expressed proteins identified by the TMT proteome analysis were presented as a volcano plot depicting mean quantitation intensity ratios of the ΔprsA mutant versus WT plotted against logarithmic t test P values from 2 to3 biological experiments of each strain. Proteins with π > 2.5 were highlighted in red and blue to indicate upregulation and downregulation, respectively. Proteins with significantly altered abundance between WT and ΔprsA mutants were shown in (d) and (e) for exoproteome and EV proteome, respectively. Overview of significantly differential expressed exoproteins (f) and EV proteins (g) identified in ΔprsA1, ΔprsA2 and ΔprsA1/A2 mutants. Numbers of proteins exclusively detected in each sample or shared between them were indicated in the Venn diagrams
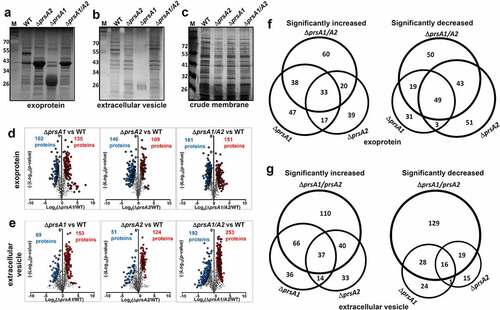
Table 1. Bacterial strains and plasmids used in this study
Table 2. KEGG pathway analysis for exoproteome
Table 3. KEGG pathway analysis for EV proteome
Table 4. Virulence factors with altered abundance in ΔprsA1/A2 culture medium
Table 5. Virulence factors with altered abundance in ΔprsA1/A2 EV
Figure 3. Dysregulated expression of GAS virulence factors in prsA deletion mutants. Representative demonstration of significantly altered virulence factors identified in M4 GAS exoproteome (a) and EV proteome (b). (c) Expression of SpeB, T4 pilus and SLO in the cell-free M4 GAS culture supernatant by Western blot analysis. (d) Expression of PrsA in the prsA-complemented M4 GAS strains. The crude membrane fractions were collected from WT, prsA-deficient mutants and prsA-complemented strains and the expression of PrsA proteins was analyzed by Western blot analysis with anti-PrsA1 and PrsA2 antibodies. (e) Expression and maturation of SpeB in the prsA-complemented M4 GAS strains. SpeB in the cell-free culture supernatant collected from stationary bacterial cultures were analyzed by Western blot analysis with anti-SpeB antibodies. (f) SpeB-mediated proteolytic activities. Filtered culture media were collected from stationary phase M4 GAS and incubated with 1% azocasein solution. The amount of cleaved azopeptides were determined by measuring the solution absorbance at 440 nm. Data shown were mean ± SD pooled from two independent experiments performed with biological triplicates. Statistical significance was determined in comparison to WT by one-way ANOVA multiple comparisons test (a, b, f). **, P< 0.01; ***, P< 0.001; ****, P< 0.0001
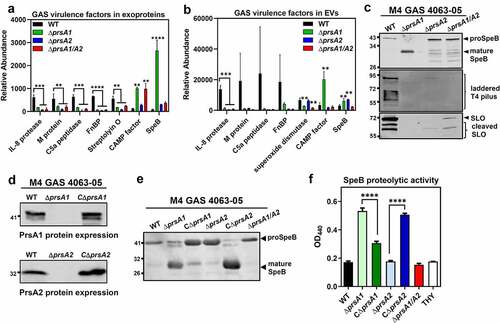
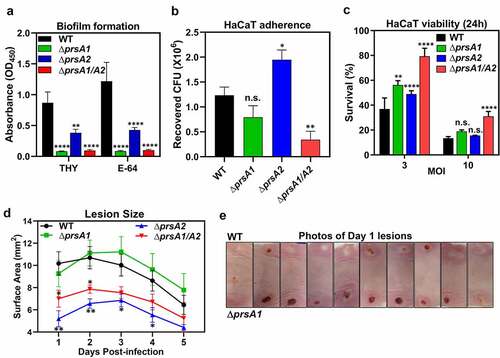
Figure 4. GAS full virulence was impaired in prsA deletion mutants. (a) Biofilm formation was impaired in prsA deletion mutants. M4 GAS was grown in 96-well polystyrene plates for 24 h in the presence or absence of SpeB inhibitor E-64, and the produced biofilm mass was stained with crystal violet and quantified by measuring the solution absorbance at 540 nm. (b) HaCaT cells were infected with M4 GAS at MOI of 10 for 30 min, followed by extensive wash to remove unbound GAS. Cell-associated GAS were enumerated by serial plating. (c) GAS-induced cell death was assessed by crystal violet staining of surviving HaCaT cells 24 h post M4 GAS infection. Data shown were mean ± SD pooled from at least two independent experiments performed with biological triplicates (a-c). (d) Lesion sizes from WT M4 GAS- and prsA deletion mutants-infected mice. Representative results from two independent experiments were shown as mean ± SD. (e) Photographs of necrotic skin lesions at day 1 from WT- and ΔprsA1-infected mice. Statistical significance was determined in comparison to WT by one-way ANOVA multiple comparisons test (a-c) or Mann–Whitney test (d). n.s., non-significant; *, P< 0.05; **, P< 0.01; ***, P< 0.001; ****, P< 0.0001