
Figures & data
Table 1. Primer information
Figure 1. Establishment of MO infection in cultured MH-S cell lines. (a) MH-S cells cultured in 6-well plate were infected with 10 MOI of MO or mock infected for the indicated hours for observation of cytopathic effect. (b) Mock- and MO-infected cells at 0, 6, 12, and 24 hpi were collected for determination of the cell viability with CCK8 assays. (c) Mock- and MO-infected cells at 0, 6, 12, and 24 hpi were collected for detection of MO-specific Hsp70 genes (397 bp) by reverse transcription-PCR assays. Lane 1 ~ 4 and lane 5 ~ 8: mock cells and MO-infected cells at 0, 6, 12, and 24 hpi, respectively; lane 9 and 10: negative control; lane 11: positive control. Mock- and MO-infected cells at 24 hpi were also collected for detection of MO infection through TEM (d) and CFM (e) analysis. For TEM (D), black arrow shows the MO-like structures. Bar: 2 μm. For CFM (E), MO was labeled with Dil probes (Orange-red fluorescence), and nucleus was stained with DAPI (blue fluorescence). Bar: 50 μm
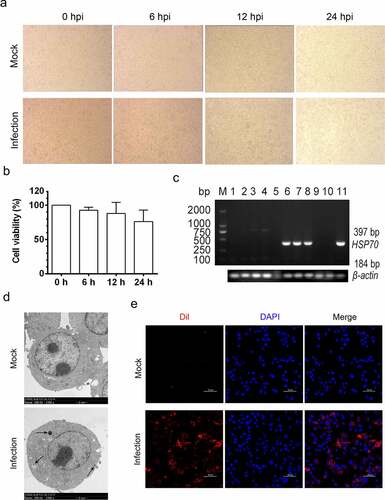
Figure 2. MO infection induces chromatin condensation and apoptotic body-like vesicles formation in MH-S cells. MH-S cells were mock-infected (a) or infected (b-d) with 10 MOI of MO for 24 hours and then collected for ultrastructural observation through TEM. Short black arrow shows the perinuclear clustering of condensed chromatin. Long black arrow indicates apoptotic bodies enwrapping condensed chromatin and cytoplasmic components. Bar: 2 or 1 μm
Figure 3. MO infection increases percent of TUNEL-positive cells in a time-dependent manner in MH-S cells. (a-c) MH-S cells cultured in 6-well plates were mock-infected or infected with 10 MOI of MO for the indicated hours for TUNEL assays. Green fluorescence indicates the TUNEL-positive apoptotic cells, and DAPI indicates nuclei. (d) The fluorescence of cells in each group are analyzed with ImageJ software, and results are expressed as percent of TUNEL-positive cells. The data shown are expressed as mean ± SD values of three independent experiments. Two-way ANOVA tests: ***, P < 0.001; ****, P < 0.0001
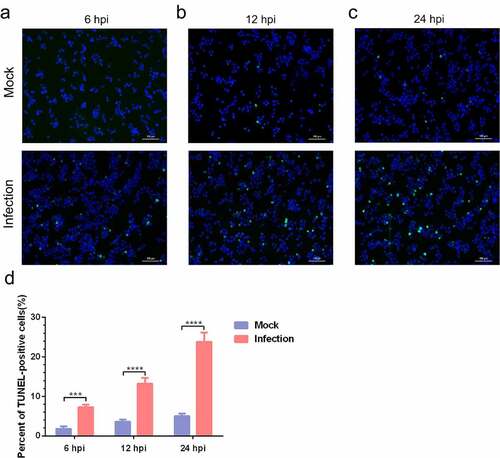
Figure 4. A time-dependent increase in apoptotic rate is detectable in MO-infected MH-S cells. (a-c) MH-S cells cultured in 6-well plates were mock-infected or infected with 10 MOI of MO in the presence or absence of 10 μM Z-IETD-FMK (a potent apoptosis inhibitor) for the indicated hours for determination of apoptosis rates by flow cytometry using an Annexin V-FITC/PI apoptosis detection kit. The percent of apoptotic cells is marked in the right side of each panel. (d) The apoptosis rates in each group were analyzed. The data shown are expressed as mean ± SD values of three independent experiments. Two-way ANOVA tests: ****, P < 0.0001
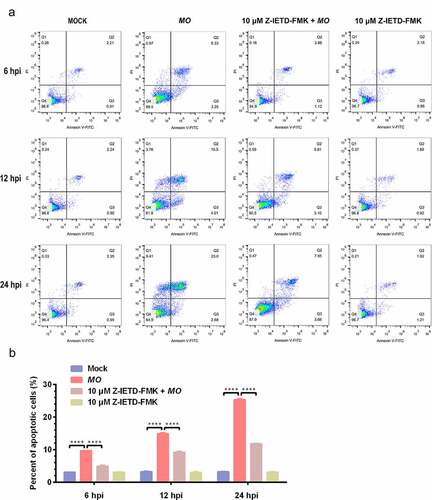
Figure 5. MO infection induces caspase-8-dependent apoptosis in MH-S cells. (a) MH-S cells cultured in 6-well plates were mock-infected or infected with 10 MOI of MO for the indicated hours for relative quantification of caspase-8 mRNA by qRT-PCR assays. Relative caspase-8 mRNA levels normalized to the β-actin gene were calculated by the 2−ΔΔCT method. Each sample was set up in triplicate. The data shown are expressed as mean ± SD values of three independent experiments. Two-way ANOVA tests: ****, P < 0.0001. (b) Samples of the mock- and MO-infected cells at 24 hpi were collected for detection of caspase-8 expression by Western blot as described in the “materials and methods”. β-actin is the loading control. (c) Grayscale value of the bands were analyzed with ImageJ software, and data shown are expressed as mean ± SD values of two independent experiments. Student’s t test: *, P < 0.05. (d) Cells plated in 24-well plates were pretreated with serial concentrations of caspase-8 inhibitor Z-IETD-FMK (10 μM, 20 μM, 30 μM) for 30 min, followed by infection with 10 MOI of MO. After 24 hours, the cells were collected for detection of apoptosis rates by flow cytometry. The apoptosis rates in each group were analyzed, and the most effective concentration of Z-IETD-FMK was selected for subsequent experiments. (e) Cells plated in 24-well plates were pretreated with 10 μM Z-IETD-FMK or equal amount of solvent prior to MO infection, or mock-infected for control. At 24 hpi, cells were collected for detection of caspase-3 mRNA levels by qRT-PCR assays. Each sample was set up in triplicate. The data shown are expressed as mean ± SD values of three independent experiments. Student’s t test: ****, P < 0.0001
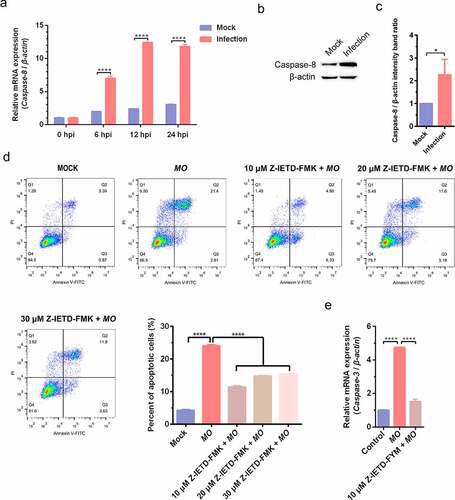
Figure 6. MO infection activates apoptosis via p53-, ROS-, but not caspase-12-dependent intrinsic pathways in MH-S cells. (a) and (g) MH-S cells cultured in 6-well plates were mock-infected or infected with 10 MOI of MO for the indicated hours for relative quantification of the p53 (A) and caspase-12 mRNA (G) by qRT-PCR assays. Each sample was set up in triplicate. The data shown are expressed as mean ± SD values of three independent experiments. Two-way ANOVA tests: ****, P < 0.0001. (b) and (h) Samples of the mock- and MO-infected cells at 24 hpi were collected for detection of p53, Bax, Bcl-2 (B) and caspase-12 (H) expression by Western blot. β-actin is the loading control. Grayscale value of the bands were analyzed with ImageJ software, and data shown are expressed as mean ± SD values of two independent experiments. Student’s t test: *, P < 0.05, ****, P < 0.0001. (c) MH-S cells cultured in 6-well plates were mock-infected or infected with 10 MOI of MO for the indicated hours for intracellular ROS assays exploiting a DCFH-DA fluorescent probe. The fluorescence intensity of each well was measured on a multifunctional plate reader at Ex/Em = 488/525 nm. The data shown are expressed as mean ± SD values of three independent experiments. Two-way ANOVA tests: ****, P < 0.0001. (d) Cells plated in 24-well plates were pretreated with serial concentrations of p53 inhibitor Pft-α (5 μM, 15 μM, 25 μM) or ROS inhibitor NAC (1:400, 1:800, 1:1 600) for 30 min, followed by infection with 10 MOI of MO. After 24 hours, the cells were collected for detection of apoptosis rates by flow cytometry. The apoptosis rates in each group were analyzed, and the most effective concentrations of Pft-α and NAC were selected for subsequent experiments. (e) Cells plated in 24-well plates were pretreated with 5 μM Pft-α or equal amount of solvent prior to MO infection, or mock-infected for control. At 24 hpi, cells were collected for detection of relative mRNA expression of Bax, Bcl-2, caspase-9, caspase-3, and AIF genes by qRT-PCR assays. Each sample was set up in triplicate. The data shown are expressed as mean ± SD values of three independent experiments. One-way ANOVA tests: ****, P < 0.0001. (f) Cells plated in 24-well plates were pretreated with the indicated concentrations of NAC or equal amount of solvent prior to MO infection, or mock-infected for control. At 24 hpi, cells were collected for detection of intracellular ROS levels and relative mRNA expression of Bax, caspase-9, and caspase-3 genes. The results shown are expressed as mean ± SD values of three independent experiments. One-way ANOVA tests: ****, P < 0.0001
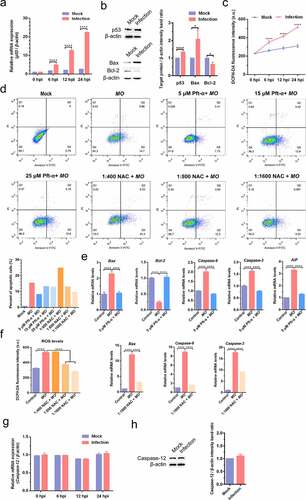
Figure 7. Caspase-8-, p53-, and ROS-dependent transcriptional enhancement of proinflammatory cytokine genes in MO-infected MH-S cells. MH-S cells cultured in 24-well plates were pretreated with 10 μM Z-IETD-FMK (a-c), 5 μM Pft-α (d-f), 1:1600 NAC (g-i), or equal amount of solvent followed by infection with 10 MOI of MO, or mock-infected for control. Cells were collected at 12 hpi, 24 hpi, and 36 hpi, respectively, and then subject to relative quantification of IL-1β, IL-18, and TNF-α mRNA by qRT-PCR assays. Relative mRNA levels normalized to the β-actin gene were calculated by the 2−ΔΔCT method. Each sample was set up in triplicate. The data shown are expressed as mean ± SD values of three independent experiments. Two-way ANOVA tests: ****, P < 0.0001
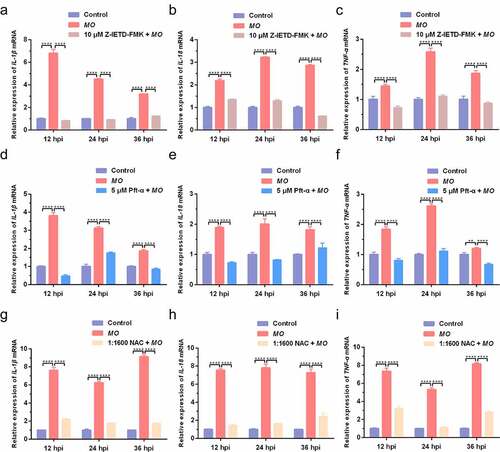
Figure 8. Caspase-8-, p53-, and ROS-dependent promotion of proinflammatory cytokine secretion in MO-infected MH-S cells. MH-S cells cultured in 24-well plates were pretreated with 10 μM Z-IETD-FMK (a-c), 5 μM Pft-α (d-f), 1:1600 NAC (g-i), or equal amount of solvent followed by infection with 10 MOI of MO, or mock-infected for control. Cell supernatants were collected at 12 hpi, 24 hpi, and 36 hpi, respectively, and then subject to determination of IL-1β, IL-18, and TNF-α secretion by ELISA assays. Standard curves were established, and values of the samples to be tested were calculated on the basis of the generated linear regression plots. The data shown are expressed as mean ± SD values of three independent experiments. Two-way ANOVA tests: *, P < 0.05; **, P < 0.01; ****, P < 0.0001
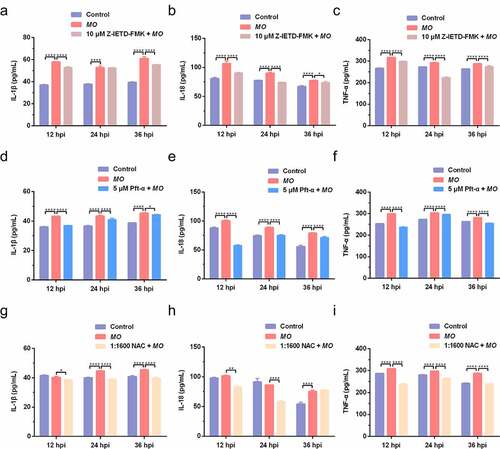
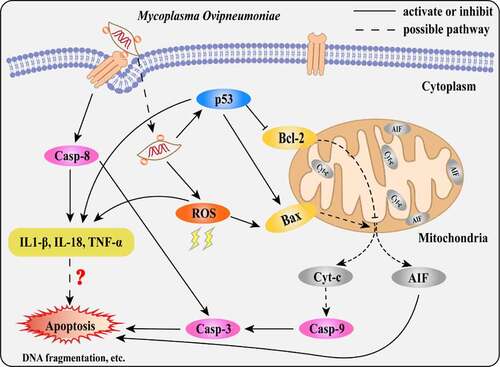
Figure 9. Scheme diagram of a proposed mechanism for MO-induced extrinsic and intrinsic apoptosis in MH-S cells. On the one hand, MO infection induces caspase-8-dependent caspase-3-mediated extrinsic apoptosis. On the other hand, MO infection activates apoptosis via p53- and ROS-dependent Bax/caspase-9/caspase-3-mediated intrinsic pathways, or AIF-mediated caspase-independent pathway. Furthermore, MO infection promotes expression of proinflammatory IL-1β, IL-18, and TNF-α in a caspase-8-, p53-, and ROS-dependent fashion, implying a potential link between MO-induced inflammation and apoptosis
Data availability statement
The data and materials used in this study are available from the corresponding author on reasonable request.