
Figures & data
Table 1. Demographic and clinical characteristics of the COVID-19 convalescent patients
Figure 1. Gating strategy and specific memory T-cell responses to SARS-CoV-2-derived peptide pools in 35 convalescent patients.
(a) Gating strategies to define SARS-CoV-2-specific CD4+ T-cells. Representative examples of flow cytometry plots of SARS-CoV-2-specific CD4+ T-cells after 6 h stimulation with Spike (Pep-S). PBMCs were isolated and stimulated by SARS-CoV-2-derived peptide pools (Pep-S, Pep-M, and Pep-N), with CMV-derived peptides (Pep-CMV), or with CytoStim. CD3, CD4 and CD8 expression was detected by surface labeling and IL-17A, TNF-α, IL-4, IL-2 and IFN-γ expression was detected intracellularly by flow cytometry. (b) Frequencies of IFN-γ-producing CD4+ T-cells. N=35. (c) Frequencies of TNF-α-producing CD4+ T-cells. N=35. Each symbol corresponds to an individual (N=35). One-way ANOVA with multiple-comparison Kruskal–Wallis tests were used. *p < 0.05. (d) Stacked bars comparing the frequency of individuals with a specific T-cell response when cells were stimulated by Pep-S, Pep-M, or Pep-N in CD4+ T cells. Individuals with SIs greater than 2 were considered responding individuals, and those with SIs lower than 2, as non-responding individuals. The response was observed as the intracellular IFN-γ or TNF-α production in CD4+ cells. N= 35. (e) Stacked bars comparing the frequencies of individuals responding and not responding to the SARS-CoV-2-derived peptides in CD8+ T-cells. N=35.
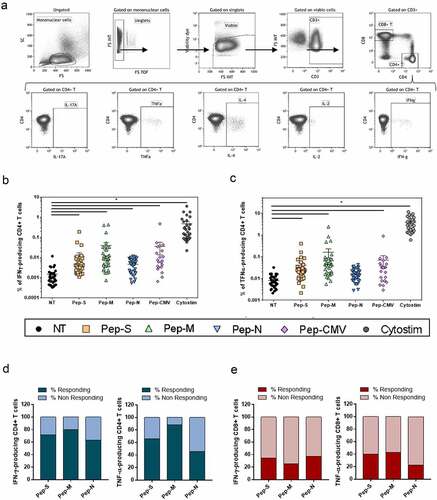
Figure 2. Frequencies of TNF-α-producing cells and time necessary for viral clearance.
Correlation between frequencies of TNF-α-producing CD4+ T-cells when non-stimulated (NT) or stimulated with Pep-S (a), Pep-M (b) or Pep-N (c), and the time between PCR+ and PCRneg. PCR+ corresponds to the detection of the SARS-CoV-2 infection, while PCRneg corresponds to the first PCR negative after the infection. Therefore, both dates allow the time for viral clearance to be determined. N=27. (d) Correlation between plasma levels of IgG anti-S1 and anti-RBD (anti-SARS-CoV-2 immunoglobulins) and the time between PCR+ and PCRneg. N=27. Coloured dotted lines estimated threshold of positivity for anti-SARS-CoV-2 immunoglobulin detection. Correlations were assessed using Spearman’s rank correlation with Hockberg’s correction for multiple testing; *adjusted p < 0.05 was considered significant. Each symbol corresponds to an individual.
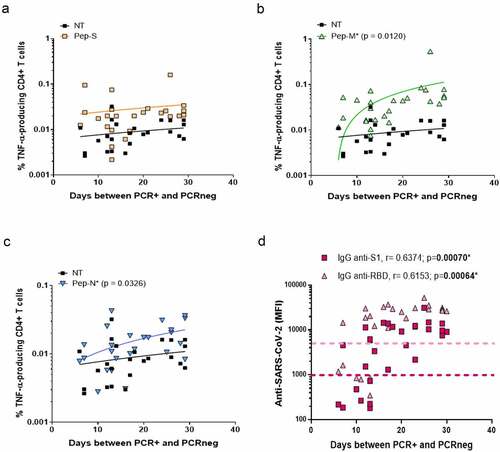
Figure 3. Specific CD4+ T-cell response to SARS-CoV-2 peptides at 10 months post-infection.
(a) Correlation between the plasma levels of anti-S1 and anti-RBD (anti-SARS-CoV-2 immunoglobulins) and the time between the detection of COVID-19 infection (PCR+) and the time of sample processing (days post-PCR+; P-PCR+). Coloured dotted lines represent the threshold of detection. N=33. (b) Correlation between the SI of TNF-α-producing CD4+ T-cells after stimulation and days P-PCR+. Symbols in the gray zones represent samples with SIs less than 2, indicating non-responding individuals. Correlations were assessed using Spearman’s rank correlation; * p < 0.05 was considered significant. Each symbol corresponds to an individual, N=35. (c) Stacked bars represent the frequencies of individuals with TNF-α-specific T-cell responses corresponding to SIs ≥ 2 (responding) or < 2 (non-responding) when cells were stimulated by Pep-S, Pep-M or Pep-N, in individuals tested 12–150 days P-PCR+ or 150–305 days P-PCR+. N=35.
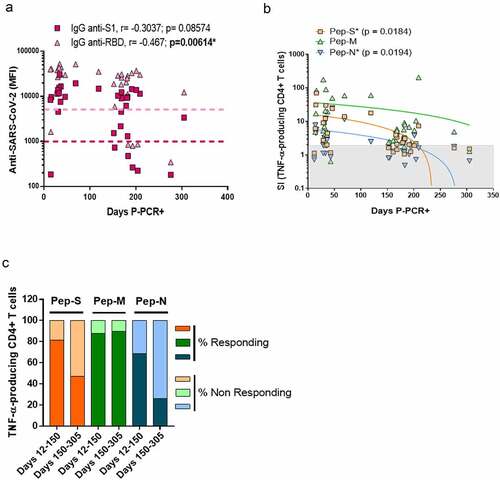
Figure 4. Age and blood groups as factors for viral clearance.
(a)Correlation between the ages of the individuals and numbers of days between P-PCR+ and PCRneg. Each symbol corresponds to an individual, N=27. (b) Numbers of days between PCR+ and PCRneg in A-group (N=12), inO-group (N=11) and in non-O-group (N=16) individuals. Mann–Whitney U test. *p < 0.05 was considered significant. Correlations were assessed using Spearman’s rank correlation and comparison using Mann-Whitney U tests, both with Hockberg’s correction for multiple testing,
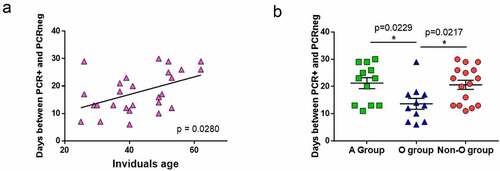
Figure 5. Blood groups as a factor for immune response.
(a) Whole blood was stained for the determination of the absolute numbers of lymphocytes (AbsN), CD4+ T-cells, and CD8+ T-cells in non-O- (N=21) and O-group (N=13) individuals. (b) Absolute numbers of lymphocytes in non-O- and O-group individuals tested 12–150 days P-PCR+ (N=7 for non-O-group and N=7 for O-group) or 150–305 days P-PCR+ (N=14 for non-O-group and N=6 for O-group). (c) Absolute numbers of CD4+ T cells in non-O- and O-group individuals tested 12–150 days P-PCR+ (N=7 for non-O-group and N=7 for O-group) or 150–305 days P-PCR+ (N=14 for non-O-group and N=6 for O-group). (d) Absolute numbers of CD4/CD8 double-positive (DP T) or double-negative T cells (DN T) in non-O- and O-group individuals. Absolute numbers of CD4/CD8 double-positive (DP T, e) or double-negative T cells (DN T, f) in non-O- and O-group individuals tested 12–150 days P-PCR+ (N=7 for non-O-group and N=7 for O-group) or 150–305 days P-PCR+ (N=14 for non-O-group and N=6 for O-group). (g) Heat map of Spearman correlation coefficients for indicated features in O-group individuals (N=14). Spearman’s correlation and Mann–Whitney U tests were employed using Hochberg’s correction for multiple testing. *p < 0.05 was considered significant.
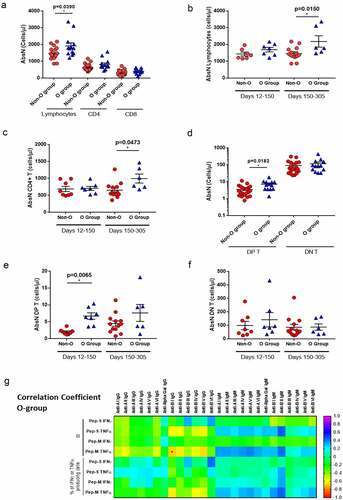
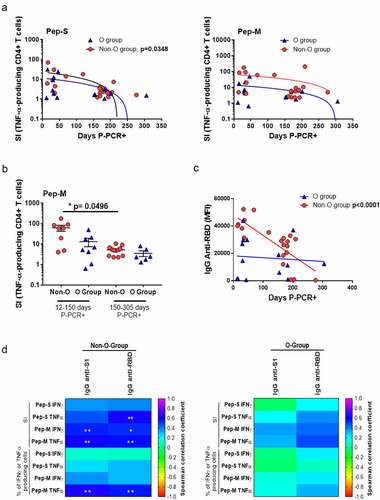
Figure 6. Blood groups as a factor for specific CD4+ T-cell response.
(a) Correlations between SI of TNF-α-producing CD4+ T-cells when stimulated with Pep-S (left panel) and Pep-M (right panel) in O-/non-O-groups (N=14/21) and days P-PCR+. (b) Frequencies of TNF-α-producing CD4+ T-cells, when stimulated with Pep-M in O-/non-O-group individuals, tested 12–150 days P-PCR+ (N=8/N=8) or 150–305 (N=6/N=12) days P-PCR+. (c) Correlations between level of anti-RBD immunoglobulins and days P-PCR+. Each symbol corresponds to an individual (N=21 for non-O-group and N=14 for O-group). (d) Heat map of Spearman correlation coefficients of indicated features in non-O-group (left panel, N=21) and O-group (right panel, N=14) individuals. Correlations were assessed using Spearman’s rank correlation with Hochberg’s correction for multiple testing. *p < 0.05; **p < 0.01.
Supplemental material