Figures & data
Figure 1. Survival of T. pyogenes in host cells. a. T. pyogenes can invade the cytosol of gEECs. gEECs were uninfected (CTR) or infected with T. pyogenes for one to four hours and were analyzed by immunofluorescence with DAPI to visualize both the nucleus and bacterial cells. Scale bar, 100 μm. b. gEECs were infected with T. pyogenes (MOI = 50) for 30 minutes to four hours. Cells were lysed with Triton X-100 (0.1%) and the lysate was inoculated into BHI medium, serially diluted, and plated on BHI agar. Colonies were counted after incubation at 37°C for 48 hours. The data are representative of three independent experiments (n = 3) .
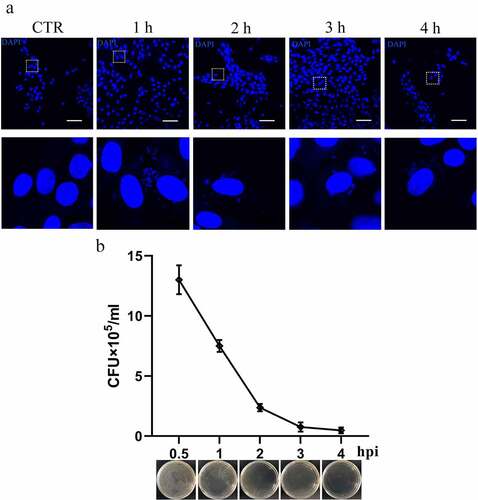
Figure 2. T. pyogenes induces ER stress and UPR. gEECs were uninfected (CTR) or infected with T. pyogenes (MOI = 50) for 30 minutes to four hours. Cells were lysed for Western blotting with antibodies against GRP78 (a), ATF6 (b), p-IRE1 (c), XBP1s (d), p-eIF2α (e), and ATF4 (f). The loading control was β-actin. #, nonspecific band. Target bands were quantified by ImageJ software relative to the corresponding loading control. The data are representative of three independent experiments (n = 3). One-way ANOVA was performed, and data were expressed as the mean ± SEM, *P < 0.05.
Figure 3. T. pyogenes intracellular survival is regulated by ER stress and UPR. a. gEECs were preincubated with 4-PBA (0.5 μM), Tm (0.5 μM) or PBS, and were then infected with T. pyogenes (MOI = 50) for 30 minutes to four hours. CFU were counted as outlined in Materials and Methods. b. Efficiency of lentivirus infection was examined by observing GFP tags after puromycin selection. Scale bar, 100 μm. c. Western blotting to analyze protein expression of XBP1, eIF2α and ATF6 in the constructed cell lines. d. Target bands were quantified by ImageJ software relative to the corresponding β-actin loading control to analyze interference efficiency. e. Cell lines of sh-N, sh-XBP1, sh-eIF2α and sh-ATF6 were infected with T. pyogenes (MOI = 50) for one or two hours. CFU were counted as outlined in the legend. The data are representative of three independent experiments (n = 3). In A, D and E, two-way ANOVA (a, e), or one-way ANOVA (d) were performed, and data were expressed as the mean ± SEM, *P < 0.05, **P < 0.01.
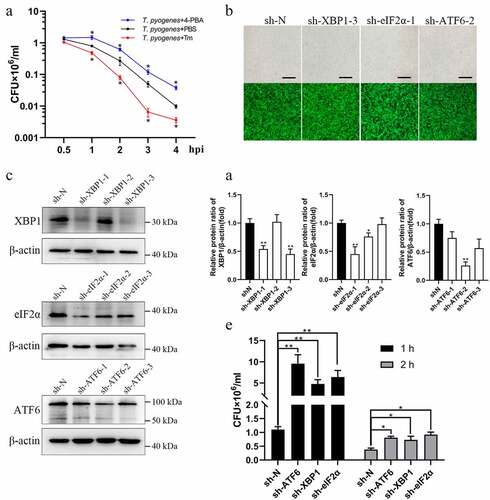
Figure 4. Knockdown of ATG5 blocks the process by which ER stress inhibits intracellular survival of T. pyogenes. a. gEECs were uninfected (CTR) or were infected with T. pyogenes for two hours and were analyzed by immunofluorescence with anti-LC3 antibody. The nucleus and bacterial cells were visualized wtih DAPI. Scale bar, 10 μm (CTR) and 5 μm (T. pyogenes). b. gEECs were uninfected (CTR) or were infected with T. pyogenes for 30 minutes to four hours and LC3-II protein expression was analyzed by Western blotting. c. gEECs were uninfected (CTR) or infected with T. pyogenes for one or four hours and cells were fixed and processed for transmission electron microscopy analysis. Scale bars are shown in the images. D-F. gEECs were transfected with small interference RNA (siRNA), including si-N and si-ATG5, for the following assays. d. Interference efficiency was detected by RT-qPCR and the relative ATG5 mRNA transcript levels were analyzed by the 2−ΔΔCt method. e. gEECs were preincubated with Tm (0.5 μM) or PBS and were then infected with T. pyogenes (MOI = 50) for two hours. CFU were counted as outlined in the legend. f. gEECs were infected with T. pyogenes (MOI = 50) for two hours and ER stress and UPR protein expression were analyzed by Western blotting. The data are representative of three independent experiments (n = 3). In B, D and E, one-way ANOVA (b), unpaired t-test (d) or two-way ANOVA (e) were performed, and data were expressed as the mean ± SEM, *P < 0.05.
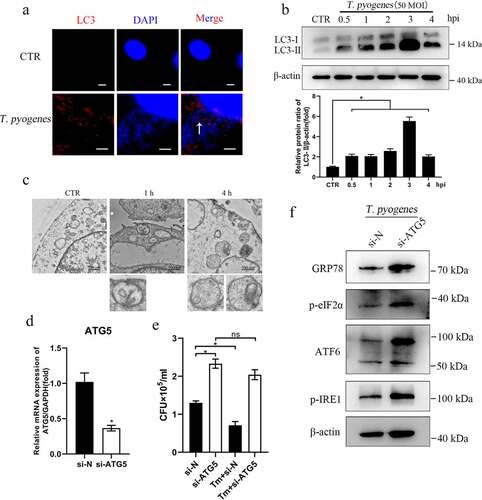
Figure 5. Apoptosis was induced in gEECs by severe infection with T. pyogenes. gEECs were uninfected (CTR) or were infected with T. pyogenes (MOI = 100) for 30 minutes to four hours. a. Relative mRNA transcript of CHOP was detected by RT-qPCR and was analyzed by the 2−ΔΔCt method. b, c. CHOP and cleaved-Caspase3 protein expression was analyzed by Western blotting. d, e. Cells were analyzed by flow cytometry after stained with annexin V and propidium iodide (PI). One-way ANOVA was performed, and data were expressed as the mean ± SEM, *P < 0.05. The data are representative of three independent experiments (n = 3) .
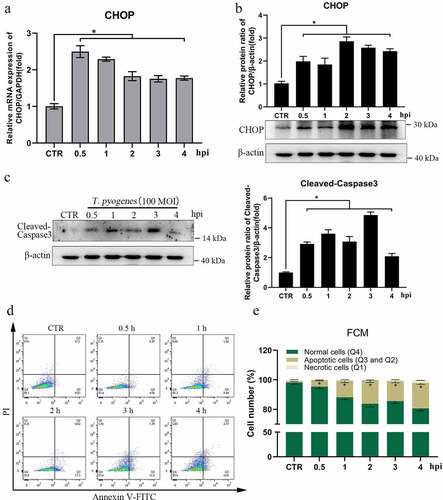
Figure 6. T. pyogenes induces an inflammatory reaction in gEECs. gEECs were uninfected (CTR) or were infected with T. pyogenes (MOI = 50) for 30 minutes to four hours. a-d. Relative mRNA transcripts of IL-1β, IL-6, TNF-α and COX-2 were detected by RT-qPCR and were analyzed the by 2−ΔΔCt method. e. NF-κB p65 protein expression was analyzed by Western blotting. f. Target bands were quantified by ImageJ software relative to β-actin. One-way ANOVA was performed, and data were expressed as the mean ± SEM, *P < 0.05, **P < 0.01. The data are representative of three independent experiments (n = 3) .
Figure 7. T. pyogenes induced an inflammatory reaction in gEECs regulated by ER stress and UPR. Cell lines of sh-N, sh-ATF6, sh-eIF2α and sh-XBP1 were infected with T. pyogenes (MOI = 50) for two hours. a-c. NF-κB p65 and the corresponding target proteins of the relevant cell lines were detected by Western blotting. Target bands were quantified by ImageJ software relative to β-actin. d-f. Relative mRNA transcripts of IL-1β, IL-6, TNF-α and COX-2 were detected by RT-qPCR in sh-ATF6 (d), sh-eIF2α (e) and sh-XBP1 (f) cell lines compared to sh-N. The 2−ΔΔCt method was used to analyze mRNA expression relative to GAPDH. Unpaired t-test was performed. *P < 0.05; **P < 0.01. The data are representative of three independent experiments (n = 3) .
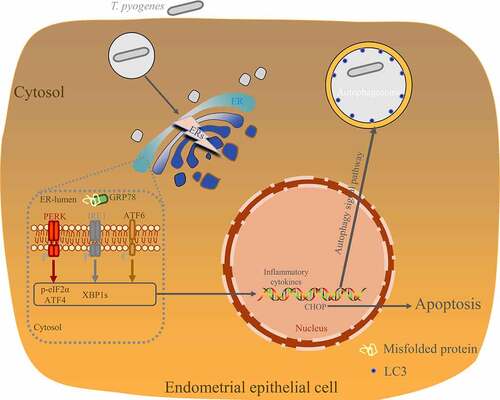
Figure 8. Schematic model delineating the pathway of the responsiveness of cells to T. pyogenes. T. pyogenes infection induces the ER stress mediated-UPR signaling pathway. Autophagy and apoptosis are triggered to counteract the invading bacteria.