
Figures & data
Figure 1. Permeability of ARS in bacterial species.
Representative fluorescence microscopic images by fluorescence-labeled ARS (ARSF) in yeast and various bacterial species. The budding yeast (S. cerevisiae, SC) and Gram-negative (P. aeruginosa, PA; V. cholerae, VC; and E. coli, EC) and Gram-positive (S. aureus, SA; and B. subtilis, BS) bacteria were incubated with 0.1 mg/ml of ARSF for 5 min (upper panel) and 40 min (lower panel). After incubation, the cells were washed with PBS, and visualized by fluorescence microscopy. No autofluorescence was detected without ARSF in this experimental condition.
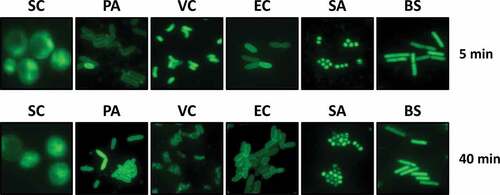
Figure 2. Antibacterial efficacy of ARS in vivo and in vitro.
(A to C) Survival rates of bacteria-infected flies were determined upon administration of an ARS derivative, artesunate (ART). The bacterial pathogens such as PA (A), SA (B), and VC (C) were introduced into the flies with either nothing (open) or ART (1 mg/ml or 5 mg/ml for PA and SA, 0.1 mg/ml or 0.5 mg/ml for VC) (filled). Those infected flies were transferred to the new corn meal media, and the survival was measured over time. The dotted lines represent the time required to reach 50% mortality. The statistical significance based on a log-rank test is indicated (**, p < 0.005; ***, p < 0.001). (D) Susceptibility of bacterial species to ARS and ART. The Gram-negative (PA, VC, and EC) and Gram-positive (SA and BS) cells were grown to a logarithmic growth phase. Ten-fold serial dilutions from the cell cultures were spotted onto an LB agar plate (-) or an LB agar plate containing 12.5 μg/ml of either ARS or ART. The numbers indicate the log(cfu) of the applied bacterial spots. (E) Minimal inhibitory concentrations (MICs) of ARS and ART for the bacterial species in (D).
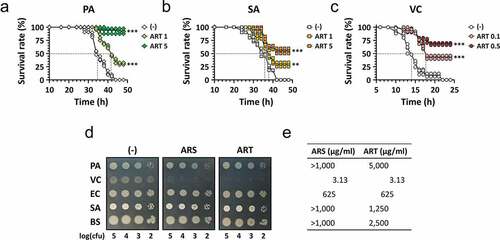
Figure 3. Enhancement of ARS-induced ROS generation in VC.
(A) ROS generation by ART in vivo. The VC, PA, and EC cells (5 × 10⁵ cfu/ml) that had been grown to a logarithmic growth phase were incubated for 3 h in M9 minimal medium containing hydroxyphenyl fluorescein (HPF), with nothing (-) or ART (313 μg/ml). The ROS generation is analyzed by the levels of the HPF fluorescence under fluorescence microscope, which were merged with the bright-field microscopic images. (B) Antibacterial activity of ART under anaerobic condition. The VC and PA (anr and oxyR mutants) cells were grown to the logarithmic growth phase. Ten-fold serial dilutions from the cell cultures were spotted onto an LB agar plate (-) or an LB agar plate containing 12.5 μg/ml of ART for aerobic culture. For anaerobic culture, 50 mM KNO3 was added to LB agar plates. The numbers indicate the log(cfu) of the applied bacterial spots.(C) Effect of catalase on ARS-induced VC killing. The VC cells containing either pBAD24 (-) or pBAD24-KatA (KatA OP) were grown to the logarithmic growth phase and then pulse-treated with ART (313 μg/ml) or H2O2 (750 μM). After treatment, the cells were stained using the mixture of SYTO9 and propidium iodide (PI) and visualized by fluorescence microscope.
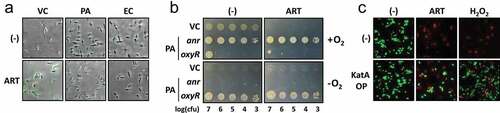
Figure 4. Enhancement of ARS-induced DNA damage in VC.
(A and B) Formation of DNA double-strand breaks (DSBs) by ART in vivo. The VC cells were treated with either ART (31.3 μg/ml) and H2O2 (150 μM) for 30 min. The DNA DSBs were monitored as the foci formation by RecN-mClover3, which was visualized by fluorescence microscope (A). The foci-positive cells in A were counted as the cells with DNA damage and the fractions of those with DNA damage were quantitated (B). Statistical significance between the groups is indicated, based on a p value of less than 0.001 (***) by Student’s t test. The values are averaged from the three independent technical replicates and the error bars represent the standard deviations.
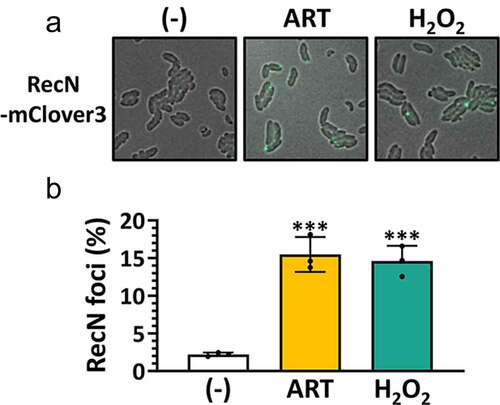
Figure 5. Enhanced antibacterial activity of ARS by copper addition.
(A) Effect of transition metal ions, Fe2+ or Cu+ on the susceptibility of VC to the sub-inhibitory concentration (1.57 μg/ml) of ART (ARTsub). The VC cells were grown to the logarithmic growth phase. Ten-fold serial dilutions from the cell cultures were spotted onto an LB agar plate (-) and an LB agar plate with ART (ARTsub), which had been unsupplemented (-) or supplemented with 2.5 mM FeSO4(Fe2+sub), or 0.313 mM CuCl (Cu+sub). The numbers indicate the log(cfu) of the applied bacterial spots. (B) Effect of Cu+ on the pulse-treatment of ART in VC killing. The VC cells were grown to the logarithmic growth phase. The cells were pulse-treated with ART (31.3 μg/ml) and/or CuCl (0.25 mM). After treatment, the cells were stained using a mixture of SYTO9 and propidium iodide (PI) and visualized by fluorescence microscope. (C) Effect of Cu+ on the susceptibility of bacterial species to the sublethal concentration of ART (ARTsub). The five bacterial (PA, VC, EC, SA, and BS) cells (5 × 10⁵ cfu/ml) were treated with the following: noting (empty); ART (yellow; ARTsub) at the sub-inhibitory concentrations (PA, 1.25 mg/ml; VC, 0.75 μg/ml; EC, 0.156 mg/ml, SA, 0.313 mg/ml; BS, 0.625 mg/ml); CuCl (green; Cu+sub) at the sub-inhibitory concentrations (VC, 0.313 mM; PA, SA, and BS, 0.625 mM; EC, 1.25 mM); ART and CuCl (dark green; ARTsub+Cu+sub) at the indicated concentrations. The survivor cells were enumerated by viable cell counts. Statistical significance between the groups is indicated, based on a p value of less than 0.01 (*), 0.005 (**) or 0.001 (***) by Student’s t test. (D) Strand break induction by ARS and ART in vitro. The supercoiled (sc) plasmid DNA samples were incubated for 20 min with ART (10 mM) or ARS (10 mM) in the presence of GSH (20 μM) and either FeSO4 (10 μM) or CuCl (10 μM). Conversion of the sc DNA (filled arrow head) to either the open-circle (single-strand breaks) and/or to linear (double-strand breaks) forms (empty arrow head) was monitored by gel electrophoresis. Extensive double-strand breaks lead to DNA degradation. The control experiments with each component (GSH, ART, or ARS) were also performed.
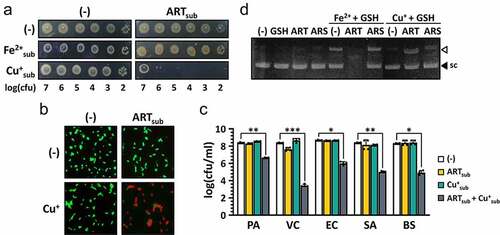
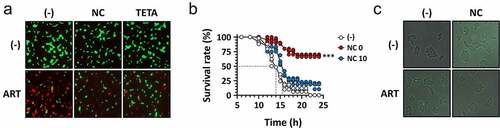
Figure 6. Reduced antibacterial activity of ARS by copper chelators.
(A) Effect of copper chelators on the ART-induced VC killing. The cells that had been grown to the logarithmic growth phase were treated with copper chelators, neocuproine (NC) (1.5 μM), or triethylenetatramine (TETA) (1.5 mM). After the chelator treatment, the cells were incubated with ART (313 μg/ml) for 1 h, stained as in and visualized by fluorescence microscope. (B) Effect of NC on the antibacterial efficacy of ART in Drosophila infections. Survival rates of VC-infected and ART-treated flies were determined upon NC. The flies were infected with VC cells that had been co-treated with ART (0.1 mg/ml) and NC at the indicated concentrations (0 or 10) (μM) and then transferred to new media. The survival was measured over time for the infected flies. The dotted lines represent the time required to reach 50% mortality. The statistical significance based on a log-rank test is indicated (***, p < 0.001). (C) Effect of copper chelators on the ART-induced DSBs. The VC cells were treated with NC (1.5 μM) and then incubated for 30 min on LB agarose pad with nothing (-) or ART (31.3 μg/ml). The DNA DSBs were monitored for the foci formation by RecN-mClover3, which was visualized by fluorescence microscope.
Supplemental material
Supplemental Material
Download Zip (755.8 KB)Data availability statement
The data that support the findings of this study are available from the corresponding author upon reasonable request ([email protected]).