Figures & data
Table 1. Host spectrum of bacteriophage PHB21
Table 2. Minimum lethal dose (MLD) of S. aureus SA14 and SA14+ in mouse models
Figure 1. Characteristics of bacteriophage vB_Saus_PHB21. (a) Plaques (indicated using red arrows) formed by PHB21 on Methicillin-resistant Staphylococcus aureus growing agar; (b) morphological characteristics of phage PHB21 under the electron microscopy; (c) comparative analysis of PHB21 complete genome sequence and the complete genome sequence of Staphylococcus phage Sa2wa_st8 (GenBank accession no. MK940809.1); arrows refer to the coding sequence regions; (d) phylogenetic analysis of PHB21 and the other Staphylococcus phages; the tree was generated based on nucleotide sequences of the large terminase subunit encoding genes.
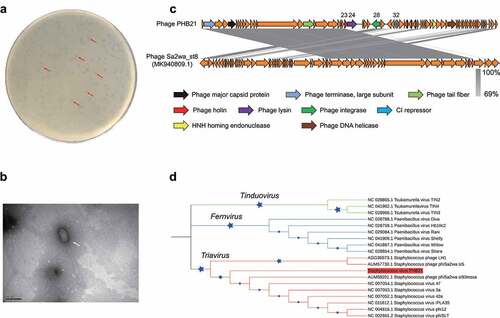
Figure 2. Generation and phenotypical characteristics of PHB21 lysogens. (a) A model for the generation of PHB21 lysogens; (b) the attachment site (attP) of PHB21 in the chromosome of lyse the lysogenic strain SA14+ determined using ONT sequencing; panel (c) indicates the staphyloxanthin produced by SA14+ and SA14 during the culture (at 24 h post inoculation); panels (d) to (f) show the biofilm formation of SA14+ and SA14 in crystal violet staining (panel D), OD590 measurement (panel (e)), and bacterial counting (panel (f)); panels (g) to (j) show the capacities of SA14+ and SA14 adherence and invasion to host cells (panel (g), percent adhesion plus invasion [P = 0.008]; panel (h), percent adhesion [P = 0.008]; panel (i), percent invasion [P = 0.120]), and anti-phagocytosis (panel (j), P = 0.014). Data represents mean ± SD and were analyzed through “Multiple t tests”. The significance level was set at P < 0.05 (*) or P < 0.01 (**). Raw data for cell adhesion, invasion, and anti-phagocytosis assays are shown in Table S3 in supplementary materials.
![Figure 2. Generation and phenotypical characteristics of PHB21 lysogens. (a) A model for the generation of PHB21 lysogens; (b) the attachment site (attP) of PHB21 in the chromosome of lyse the lysogenic strain SA14+ determined using ONT sequencing; panel (c) indicates the staphyloxanthin produced by SA14+ and SA14 during the culture (at 24 h post inoculation); panels (d) to (f) show the biofilm formation of SA14+ and SA14 in crystal violet staining (panel D), OD590 measurement (panel (e)), and bacterial counting (panel (f)); panels (g) to (j) show the capacities of SA14+ and SA14 adherence and invasion to host cells (panel (g), percent adhesion plus invasion [P = 0.008]; panel (h), percent adhesion [P = 0.008]; panel (i), percent invasion [P = 0.120]), and anti-phagocytosis (panel (j), P = 0.014). Data represents mean ± SD and were analyzed through “Multiple t tests”. The significance level was set at P < 0.05 (*) or P < 0.01 (**). Raw data for cell adhesion, invasion, and anti-phagocytosis assays are shown in Table S3 in supplementary materials.](/cms/asset/8102d6cc-2f92-4fa8-98b5-8ca7c6499605/kvir_a_2022276_f0002_oc.jpg)
Figure 3. Evaluation of bacterial virulence of MRSA strains SA14+ and SA14 using different models. Panel (a) shows the color change of Galleria mellonella larvae challenged by MRSA strains; when a larva died due to bacterial infection its color turned to black; panel (b) displays the mortality curves of Galleria mellonella larvae due to the infections caused by different concentrations of MRSA strain SA14 and SA14+; panel (c) exhibits the histological damages (indicated by black arrows) on mouse lungs (HE, ×200), livers (HE, ×200), and spleens (HE, ×200) due to the infections of different MRSA strains; panels (d) to (f) show the production of different cytokines (IL-8, IFN-γ, and TNF-α) in mouse sera induced by the infections of different MRSA strains at different time points post challenge. Data represents mean ± SD. The significance level was set at P < 0.05 (*).
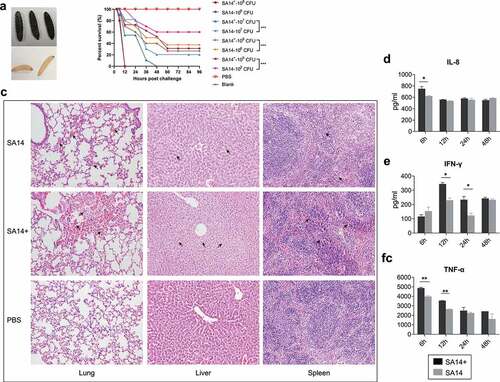
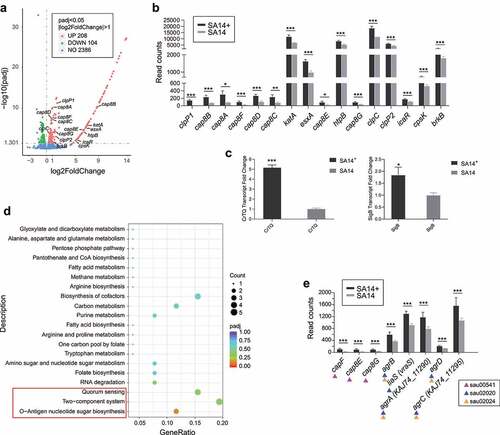
Figure 4. Transcriptome analysis of the MRSA lysogenic strain SA14+. (a) Scatter plot displays the differentially expressed genes in the lysogenic strain SA14+ compared to those in the wild type strain SA14; (b) column chart shows the transcription of virulence associated genes in the lysogenic strain SA14+ compared to those in the wild type strain SA14; (c) column chart shows the transcription of with the synthesis and export of staphyloxanthin in the lysogenic strain SA14+ compared to those in the wild type strain SA14; (d) enriched KEGG pathways related to the upregulated genes expressed in SA14+ compared to the wild type strain SA14; (e) the transcription of genes related to O-antigen nucleotide sugar biosynthesis (KEGGID: sau00541), two-component system (KEGGID: sau02020), and quorum sensing (KEGGID: sau02024) in MRSA strains SA14+ and SA14. Data represents mean ± SD. The significance level was set at P < 0.05 (*).