
Figures & data
Table 1. Epidemiological characteristics of all 108 cases of Legionnaires’ disease
Figure 1. Whole genome-based phylogenetic tree of 108 Lp1 clinical isolates. The interior ring corresponds to clinical isolates STs and the exterior ring corresponds to a heatmap representing TNF-α secretion levels by infected U937 cells.
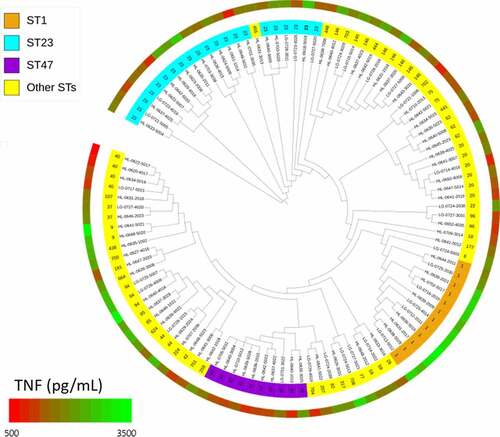
Figure 2. TNF-α secretion from human U937 macrophages infected by Lp1 clinical strains. U937 cells were infected (MOI 1) with 108 Lp1 clinical isolates, and the levels of TNF-α in culture supernatants were determined by ELISA at 24 h post-infection. Scattergram of secreted TNF-α concentrations by U937 cells upon infection with (a) non-ST1 (n = 96) and ST1 (n = 12) strains, (b) non-ST23 (n = 87) and ST23 (n = 21) strains, (c) non-ST47 (n = 98) and ST47 (n = 10) strains, and (d) ST1 (n = 12), ST23 (n = 21) and ST47 (n = 10) strains. Data points show mean of triplicate. The lines represent the mean value for each group and the dashed lines represent the mean value in non-infected cells. *p < 0.05; **p < 0.01; ***p < 0.001; ns, non-significant. Data are representative of two independent experiments.
Figure 3. LDH and caspase-3 activities from macrophages infected with ST1 and ST47 clinical strains. U937 cells were infected (MOI 1) with 61 Lp1 clinical isolates, belonging to the main STs (i.e. ST1, ST20, ST23, ST40, ST47, and ST146), and the activities of LDH and caspase-3 were determined in culture supernatants at 24 h post-infection. Scattergram of LDH (a, c, e) and caspase-3 activities (b, d, f) in U937 cells upon infection with (a, b) non-ST1 (n = 49) and ST1 (n = 12) strains, (c, d) non-ST47 (n = 51) and ST47 (n = 10) strains, and (e, f) ST1 (n = 12) and ST47 (n = 10) strains. Data points show mean of triplicate. The lines represent the mean value for each group and the dashed lines represent the mean of LDH or caspase-3 activities in non-infected cells. **p < 0.01; ***p < 0.001. Data are representative of at least three independent experiments.
Figure 4. Involvement of TNF-α in LDH and caspase-3 activities from macrophages infected with ST1 and ST47 clinical strains. U937 cells were infected (MOI 1) with ST1 (n = 12) or ST47 (n = 10) clinical isolates and treated with anti-TNF-α antibody. The levels of TNF-α secretion and LDH and caspase-3 activities were determined in culture supernatants at 24 h post-infection. Correlation between TNF-α levels and LDH activity (a) and between TNF-α levels and caspase-3 activity (b) in U937 cells infected with ST1 or ST47 clinical isolates. Graph showing the LDH (c) and caspase-3 activities (d) in U937 cells upon infection with ST1 and ST47 strains treated with anti-TNF-α antibody (+) or the corresponding isotype control (-). Data points show mean of triplicate. *p < 0.05; ***p < 0.001, treated versus non-treated cells. r, Pearson’s correlation coefficient. Data are representative of at least three independent experiments.
Figure 5. TNF-α is produced by both infected and bystander macrophages. U937 cells were infected at MOI 5 for 4 or 8 h with ST1 (n = 8) or ST47 (n = 10) and sorted by flow cytometry. (a) Representative plots from non-infected cells (negative control) and cells infected by a ST47 clinical strain at 8 h post-infection. (b) Relative contribution of bystander (uninfected) and infected cells to TNF-α production in macrophages challenged with Lp1 clinical strains. Values are means ± SD. **p < 0.01; ns, non-significant.
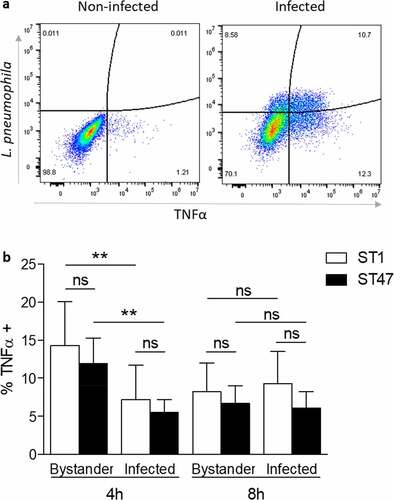
Figure 6. Intracellular replication of ST1 and ST47 clinical strains in human macrophages. U937 cells were infected (MOI 1) with ST1 (n = 11) or ST47 (n = 9) strains and the number of colony-forming units (CFU) was determined at 1, 24, 48 and 72 h post-infection. Data are representative of two independent experiments performed in triplicate and expressed as mean values.
Figure 7. TNF-α expression and secretion from macrophages infected with the ST1 Paris and ST47 Lorraine reference strains. U937 cells were infected (MOI 1) with the Paris or Lorraine reference strains, and the levels of TNF-α mRNA (a) and TNF-α in culture supernatants (b) were determined at 4 h and 16 h post-infection. Values are means ± SD and the white bars (control) represent the levels obtained in non-infected cells. *p < 0.05; **p < 0.01; ***p < 0.001; ns, non-significant. Data are representative of at least three independent experiments performed in triplicate.
Figure 8. NF-κB-induced SEAP activity from macrophages infected with the ST1 Paris and ST47 Lorraine reference strains. THP1-Blue™ NF-κB cells are macrophages expressing a secreted embryonic alkaline phosphatase (SEAP) reporter gene driven by the NF-κB promoter. Cells were infected (MOI 1) with the Paris or Lorraine reference strains, and SEAP activity (reflecting NF-κB activation) was determined in culture supernatants at 4, 8 and 24 h post-infection. Values are means ± SD. *p < 0.05; **p < 0.01; ***p < 0.001. Data are representative of at least two independent experiments performed at least in triplicate.
Supplemental Material
Download Zip (77.5 KB)Data availability statement
The data that support the findings of this study are available from the corresponding author upon reasonable request.