Figures & data
Figure 1. Growth curves in brain-heart infusion broth (BHI) medium of the six Staphylococcus aureus GTB/ST8 (shades of blue) and GTS/ST398 (shades of Orange) strains used in this study. The curves report the bacterial colony forming units (Log10 CFU)/mL as a function of time. Each point represents the mean (symbol) and standard deviation (bars) of three replicate CFU measurements. The X axis indicates the sampling times.
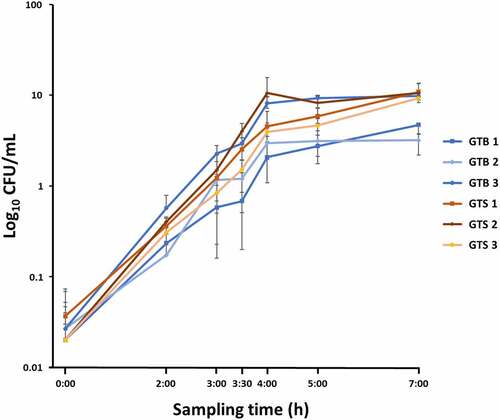
Figure 2. SDS-PAGE profile of the proteins secreted in brain-heart infusion (BHI) broth by the six Staphylococcus aureus strains evaluated in this study. The GT/ST is indicated above the name of respective S. aureus strains. Protein load is 10 µg per lane.
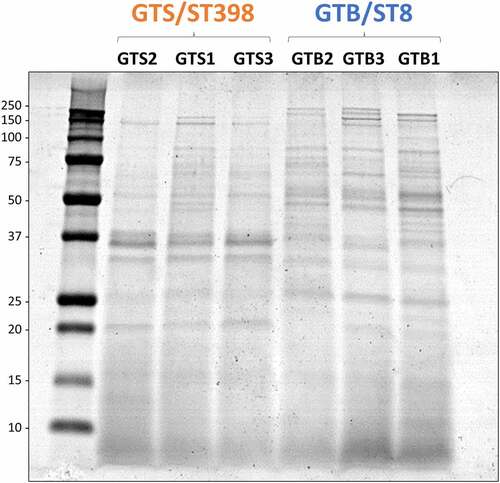
Figure 3. General results of the differential shotgun proteomics of the Staphylococcus aureus secretome obtained in brain-heart infusion (BHI) broth. (a) Principal Component Analysis based on the normalized protein abundances. (b) Venn diagram illustrating the distribution of the 720 proteins identified in the secretomes of the two GT (ST), showing shared proteins and differential proteins identified for each sample group.
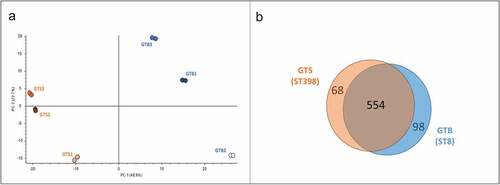
Table 1. Lists of the 98 proteins found exclusively (log2 + 6.64) or at significantly higher levels (log2 > +1.50) in the secretome of GTB/ST8 strains grown in brain-heart infusion (BHI) broth. The information reported in the first three columns (accession number, protein name, and abundance ratio – AR – expressed as the log2 value) was obtained by Proteome Discoverer Analysis. The last column reports biological process and molecular function information as found in the UniProtKB. The definition “other” indicates that the protein belongs to metabolic pathways different than amino acid, carbohydrate, lipid, or nucleotide metabolism
Table 2. Lists of the 68 proteins found exclusively (log2 − 6.64) or at significantly higher levels (log2 > −1.50) in the secretome of GTS/ST398 strains grown in brain-heart infusion (BHI) broth. The information reported in the first three columns (accession number, protein name, and abundance ratio – AR – expressed as the log2 value) was obtained by Proteome Discoverer Analysis. The last column reports biological process and molecular function information as found in the UniProtKB. The definition “other” indicates that the protein belongs to metabolic pathways different than amino acid, carbohydrate, lipid, or nucleotide metabolism
Figure 4. Distribution of the differential functions of the proteins secreted in brain-heart infusion (BHI) broth by the six Staphylococcus aureus strains evaluated in this study, classified according to the respective GT/ST. The smaller graphs illustrate the relative composition of the categories “Pathogenesis” (Orange) and “Metabolic enzyme” (blue). Abbreviations: Reg: regulation of gene expression; MDR: multidrug resistance; Amino: aminoacid metabolism; Carbo: carbohydrate metabolism; Lipid: lipid metabolism; Nucleo: nucleotide metabolism.
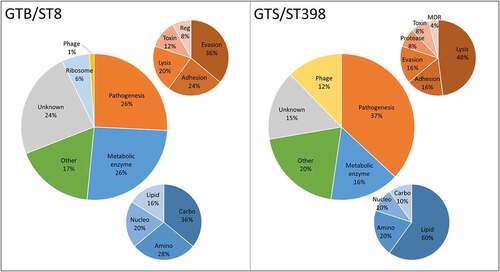
Figure 5. Heatmap of the extracellular virulence factors showing significant differences between the two GT/ST, reported in order of abundance in the respective GT/ST group. The first and second columns report the protein accession number and the protein name and acronym. The last six columns illustrate in a heat map the average normalized protein abundance value/1000 calculated for each strain with Proteome Discoverer. Color intensity ranges from the highest observed value (dark red) to the lowest observed value (dark green). White: the protein was not detected. The proteins detected only in one genotype are marked with an asterisk.
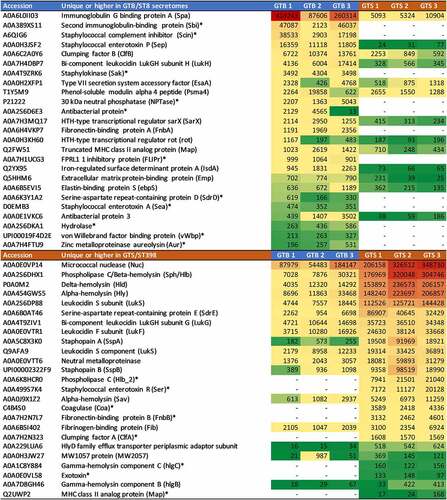
Figure 6. Heatmap of the extracellular metabolic enzymes showing significant differences between the two GT/ST, reported in order of abundance in the respective GT/ST group. The first and second columns report the protein accession number and the protein name and acronym. The third column indicates the metabolic pathway. The last six columns illustrate in a heat map the average normalized protein abundance value/1000 calculated for each strain with Proteome Discoverer. Color intensity ranges from the highest observed value (dark red) to the lowest observed value (dark green). White: the protein was not detected. The proteins detected only in one genotype are marked with an asterisk.
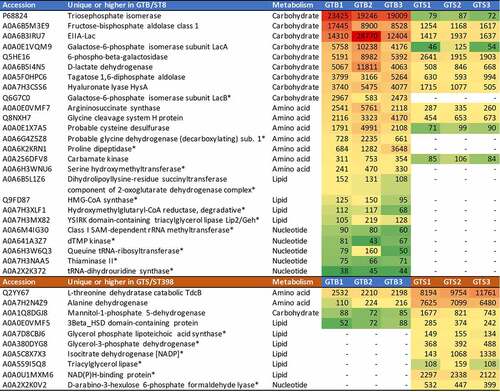
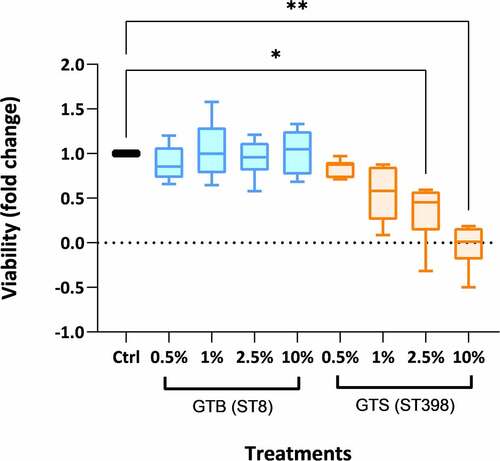
Figure 7. Peripheral blood mononuclear cell (PBMC) viability after 18 h of incubation with the proteins secreted in brain-heart infusion (BHI) broth by the two Staphylococcus aureus GT (ST) evaluated in this work. The viability is expressed as fold-change compared to cells incubated without secreted bacterial proteins (control) in six technical replicates per condition. Significance was accepted at P < 0.05 (*) and P < 0.01 (**). The lines inside the boxes denote the median. The whiskers indicate the variability outside the upper and lower quartiles.