
Figures & data
Figure 1. EVA71 infection up-regulated the level of γ-H2AX and induced DDR. (a) γ-H2AX expression was detected by Western blotting at 24 h post-EVA71 infection (MOI = 1) in RD cells. Tubulin is shown as loading control. (b) The expression of γ-H2AX and viral protein VP1 was detected by Western blotting at 6, 12, 24, and 30 h post-EVA71 infection (MOI = 1) in RD cells. Tubulin is shown as loading control. (c) The expression of γ-H2AX and viral protein VP1 was detected by Western blotting at 24 h post-EVA71 infection (MOI = 10, or 1, or 0.1) in RD cells. Tubulin is shown as loading control. (d) γ-H2AX expression was detected by Western blotting at 24 h post-EVA71 infection in MRC-5 cells (MOI = 2) or HeLa cells (MOI = 10). Tubulin is shown as loading control. (e) γ-H2AX expression was detected by Western blotting at 24 h post-CA16 infection in RD cells (MOI = 1) and HeLa cells (MOI = 10), or post-CA6 or post-EVD68 infection (MOI = 5, respectively) in RD cells. Tubulin is shown as loading control. (f) Alkaline comet assays were performed at 24 h post-EVA71 infection (MOI = 1). Representative cells from each sample are shown after performing three independent experiments. (g) RD cells were mock-infected or infected with EVA71 (MOI = 1). At 24 h post infection, cells were collected, and the cell-cycle profiles were analyzed using flow cytometry. The histograms were analyzed using the ModFit LT software to determine the percentage of cells in each phase of the cell cycle. ***P < 0.001. **P < 0.01. (h) RD cells mock-infected or infected with EVA71 (MOI = 1) were collected at 0, 12, 18 and 24 h post infection for analysis of DNA fragmentation through agarose gel electrophoresis. M denotes DNA marker.
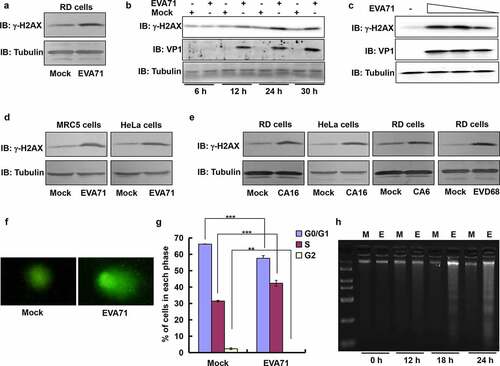
Figure 2. ATR pathway was responsible for H2AX phosphorylation and γ-H2AX formation.. (a) RD cells mock-infected or infected with EVA71 (MOI = 1) were collected at 12, 18, and 24 h post infection to detect the expression of H2AX, γ-H2AX, and VP1 proteins through Western blotting. Tubulin is shown as loading control. (b) At 24 h post-EVA71 infection (MOI = 1), the mRNA levels of H2AX were detected using real-time quantitative PCR. The results were standardized to the levels of GAPDH and normalized to 1 in mock-infected cells. Data are represented as the mean ± standard deviation of three independent experiments. NS: no significant difference. (c) The flow diagram showing the method through which RD cells were transfected with control siRNA, siATR, siDNA-PK, or siATM; 12 h later, cells were infected with EVA71 (MOI = 2) for 2 h; at 24 h post infection, the cells were collected for Western blotting analysis. (d) The expression of γ-H2AX and VP1 proteins was assessed by Western blotting after (c) treatment. Tubulin is shown as loading control. (e) Flow diagram showing the method through which RD cells were treated with inhibitors, namely ATR inhibitor (VE-821), DNA-PK inhibitor (KU 57788), or ATM inhibitor (KU 55933) after EVA71 infection (MOI = 1) at 2 h post infection. (F–H) At 2 h post-EVA71 infection, ATR inhibitor (VE-821; 0, 2, 4, 8, or 16 µM) was added for an additional 22 h (f); DNA-PK inhibitor (KU 57788; 0, 1.3, 2.5, 5, or 10 µM) was added for an additional 18 h (g); and ATM inhibitor (KU 55933; 0, 1.3, 2.5, 5, or 10 µM) was added for an additional 18 h (h); subsequently, the cells were collected for Western blotting analysis. Tubulin is shown as loading control. ATM, ataxia telangiectasia mutated; ATR, ATM and Rad3-related; EVA71, enterovirus 71; GAPDH, glyceraldehyde-3-phosphate dehydrogenase; MOI, multiplicity of infection; PCR, polymerase chain reaction; RD, rhabdomyosarcoma; siATM, siRNA targeting ATM; siATR, siRNA targeting ATR; siDNA-PK, siRNA targeting DNA-PK
Figure 3. γ-H2AX was localized to the nucleus and cytoplasm after EVA71 infection. (a) The nuclear or cytoplasmic protein of RD cells was extracted, and the level of γ-H2AX was detected by Western blotting after treatment with the positive control pseudolaric acid B (4 µM) for 36 h. Histone and GAPDH are shown as loading controls for nuclear and cytoplasmic proteins, respectively. (b) The nuclear or cytoplasmic protein of RD cells was extracted, and the level of γ-H2AX was detected by Western blotting after EVA71 infection (MOI = 1) for 12 and 24 h. Histone and GAPDH are shown as loading controls for nuclear and cytoplasmic proteins, respectively. (c) γ-H2AX distribution analysis by fluorescence microscopy at 24 h post infection. Cells were stained with γ-H2AX antibodies (Cell Signal), and co-stained with FITC labeled-secondary antibody (green). DNA was counterstained with Hoechst 33,258 (blue). Cytoskeleton was counterstained with phalloidin-tetramethylrhodamine B isothiocyanate (Red). Merged images of γ-H2AX with DNA are shown. And the corresponding white light image was kept. The arrow indicated cell with normal morphology and irregular cytoplasmic location. Scale bar: 15 µm. EVA71, enterovirus A71; FITC, fluorescein isothiocyanate; GAPDH, glyceraldehyde-3-phosphate dehydrogenase; MOI, multiplicity of infection
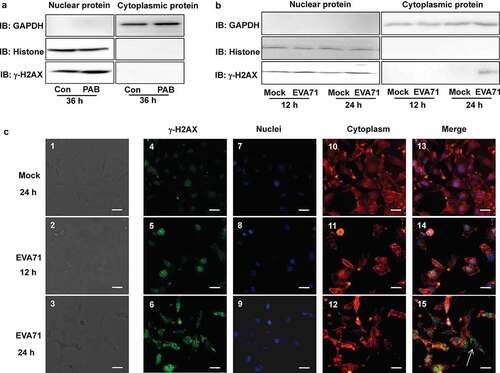
Figure 4. γ-H2AX co-localized with viral genome, viral protein VP3, and 3D. (a) The scheme of viral genome and viral protein. The viral RNA genome encodes one large polyprotein which is cleaved into precursors and finally four structural proteins, and seven non-structural proteins by 2A protease, 3 C protease or maturation. (b) EVA71 genomic content in RD cells was evaluated by RT-PCR analysis of VP1 mRNA before and after immunoprecipitation (IP) with γ-H2AX antibody (Santa). CT values of VP1 and GAPDH in input sample and IP sample with γ-H2AX antibody are shown. Data are represented as the mean ± standard deviation of three independent experiments. (c) The levels of viral proteins (VP1, VP2, VP3, 2 C, 3AB, 3 C, and 3D) in RD cells infected with EVA71 were evaluated by Western blotting before and after immunoprecipitation (IP) with γ-H2AX antibody (Cell Signal). Actin is shown as loading control. (d) HeLa cells were collected at 36 h after transfection with 10 μg of VR1012-VP3-HA (VP3-HA), VR1012-3D-HA (3D-HA) or the corresponding control vector VR1012-HA (HA). Anti-HA affinity matrix was used for immunoprecipitation of HA-tagged proteins, which were analyzed by Western blotting with γ-H2AX, VP3 and 3D antibody. The results are representative of three independent experiments. (e) The nuclear and cytoplasmic proteins of RD cells were extracted, and the levels of γ-H2AX, VP3, and 3D were detected using Western blotting after EVA71 infection (MOI = 1) for 24 h. Histone and tubulin are shown as loading controls for nuclear and cytoplasmic proteins, respectively. (f) Diagram showing that γ-H2AX forms a complex with the viral genome, viral protein VP3, and 3D in cells infected with EVA71. CT, cycle threshold; EVA71, enterovirus A71; HA, hemagglutinin; MOI, multiplicity of infection; RD, rhabdomyosarcoma; RT-PCR, reverse-transcription polymerase chain reaction; M, mock; E, EVA71
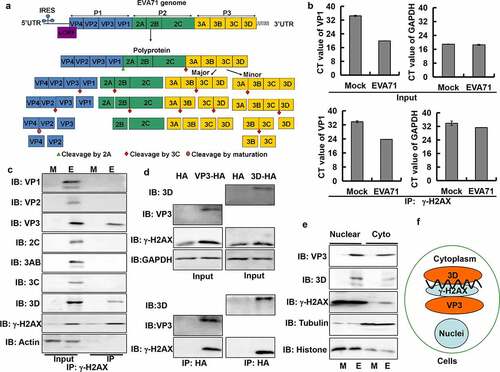
Figure 5. Knockout of H2AX decreased EVA71 genome replication and viral production. (A, B) At 4 h (a) or 24 h (b) post-EVA71 infection (MOI = 10), the mRNA levels of VP1 were detected using real-time quantitative PCR. The results were standardized to the levels of GAPDH. Data are represented as the mean ± standard deviation (SD) of three independent experiments. ***P < 0.001. NS, no significant difference. (c) At 5, 12, 20, and 26 h post-EVA71 infection (MOI = 10), the mRNA levels of VP1 or GAPDH were detected using real-time quantitative PCR. And the relative CT values (VP1-GAPDH) were shown. Data are represented as the mean ± SD of three independent experiments. ***P < 0.001. (d) At 36 h post-EVA71 infection (MOI = 100, 10, 1, 0.5 and 0.1), the mRNA levels of VP1 and GAPDH were detected using real-time quantitative PCR. The relative CT values (VP1-GAPDH) are also shown. Data are represented as the mean ± SD of three independent experiments. ***P < 0.001. (e) The expression of VP1, γ-H2AX, H2AX, and tubulin in wild-type and knockout cells at 24 h post-EVA71 infection (MOI = 10). (F) The TCID50 was assessed at 24 h post-EVA71 infection (MOI = 10). Log10TCID50/mL is shown. Data are presented as the mean ± SD of three independent experiments. ***P < 0.001. (G–I) Knockout cells were transfected with VR1012 plasmid or VR1012-H2AX plasmid. At 2 h post transfection, the cells were inoculated with EVA71 (MOI = 10) for 24 h. (g) The mRNA levels of VP1 and GAPDH were detected using real-time quantitative PCR. The results were standardized to the levels of GAPDH and normalized to 1 in cells transfected with VR1012. Data are represented as the mean ± SD of three independent experiments. ***P < 0.001. (h) Western blotting analysis of VP1, γ-H2AX, and H2AX expression. Tubulin is shown as loading control. (i) The TCID50 was assessed at 24 h post infection. Data are presented as the mean ± SD of three independent experiments. ***P < 0.001. +/+, wild type; −/−, knockout H2AX; CT, cycle threshold; EVA71, enterovirus 71; GAPDH, glyceraldehyde-3-phosphate dehydrogenase; MOI, multiplicity of infection; PCR, polymerase chain reaction; TCID50, median tissue culture infective dose
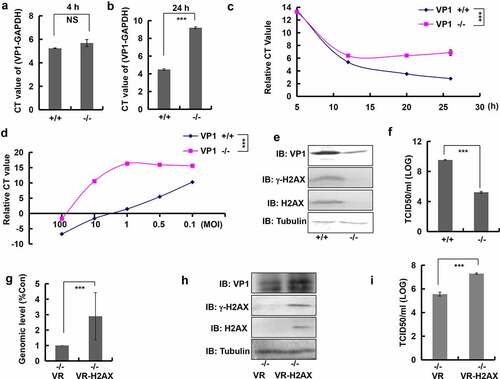
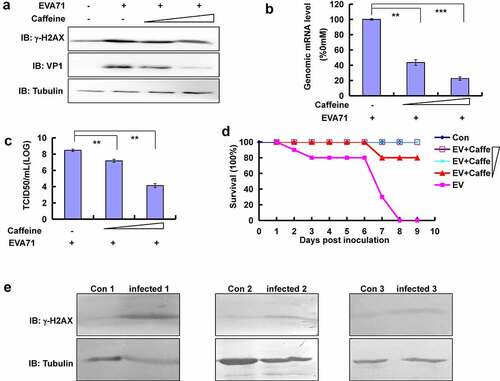
Figure 6. Confirmation of the relationship between γ-H2AX and EVA71 viral production in vitro and in vivo. (a) Caffeine (1 or 2 mM) was added to cells 2 h after infection with EVA71, and cell lysates were collected 24 h later for Western blotting analysis of VP1 and γ-H2AX expression. Tubulin is shown as loading control. (b) Pre-treatment with different doses of caffeine (0, 1, and 2 mM) for 12 h. Cells were washed once with phosphate-buffered saline (PBS) and infected with EVA71 (MOI = 1) for 2 h; subsequently, the cells were re-treated with different doses of caffeine (0, 1, and 2 mM) for 10 h. Genomic mRNA levels were detected using real-time quantitative PCR by targeting the VP1 sequence. The results were standardized to the levels of GAPDH and normalized to 100 in infected cells treated with 0 mM caffeine. Data are presented as the mean ± SD of three independent experiments. **P < 0.01, and ***P < 0.001. (c) The TCID50 was assessed at 28 h post-EVA71 infection (MOI = 1). Log10TCID50/mL is shown. Data are represented as the mean ± SD of three independent experiments. (d) Protective effect of caffeine against lethal challenge with EVA71 in vivo. Mice of the four groups were intracerebrally inoculated with 1.5 × 10⁶ TCID50 of EVA71, while those of the remaining group were intracerebrally inoculated with DMEM (10 µl/mouse). At the same time, EVA71-inoculated mice were intraperitoneally injected with 0, 2, 5, or 10 mg/kg caffeine daily for 9 days post infection, and the survival rates were monitored daily. Kaplan–Meier plots were used to calculate survival. Con: mock-infected and treated with 0 mg/kg caffeine; EV: EVA71-infected and treated with 0 mg/kg caffeine; EV+Caffe: EVA71-infected and treated with 2 mg/kg, 5 mg/kg, or 10 mg/kg caffeine. (e) The expression of γ-H2AX in children with HFMD. Blood samples were collected from control and infected children, and the levels of γ-H2AX in peripheral blood mononuclear cells were determined using Western blotting. Tubulin is shown as loading control. The results are representative of three independent experiments. Con, healthy children aged <6 years; DMEM, Dulbecco’s modified Eagle’s medium; EVA71, enterovirus 71; GAPDH, glyceraldehyde-3-phosphate dehydrogenase; HFMD, hand, foot, and mouth disease; Infected, children with infection; MOI, multiplicity of infection; PCR, polymerase chain reaction; SD, standard deviation; TCID50, median tissue culture infective dose
Supplemental Material
Download Zip (21.6 MB)Data availability statement
The datasets used and/or analyzed during the current study are available from the corresponding author on reasonable request. The data used to support the findings of this study are available at