
Figures & data
Figure 1. MERS-CoV nsp1 inhibits cell viability through its endonuclease activity. (a) HEK293T cells were transfected with MERS-CoV nsp overexpression vectors, and a CCK8 assay was performed 48 h after transfection. (b) The expression of nsp1 and β-actin was determined by Western blot in HEK293T cells. (c-d) Analysis of the cell cycle in HEK293T cells. (c) Flow cytometry analysis of the cell cycle in HEK293T cells transfected with nsp1 for 36 h. (d) Quantification of flow cytometry cell cycle analysis of nsp1. (e) The effects of MERS-CoV nsp1 on wound healing in HEK293T cells. (f) Quantification of wound closure rate. (g-l) HEK293T cells were transfected with MERS-CoV nsp1, nsp1-CD, or empty vector. (g) The expression of nsp1/nsp1-CD and β-actin was determined by Western blot in HEK293T cells. (h) A CCK8 assay was performed at the indicated time points. (i) Flow cytometry analysis of the cell cycle in HEK293T cells 36 h post-transfection. (j) Quantification of flow cytometry cell cycle analysis of nsp1 and nsp1-CD, at 36 h post ORF introduction. (k) Wound healing of HEK293T cells. (l) Quantification of wound closure rate. Data are mean ± s.d. from at least three independent experiments. *p < 0.05, **p < 0.01, ****p < 0.001.
Figure 2. MERS-CoV nsp1 selectively downregulates the mRNAs of ribosomal protein genes and oxidative phosphorylation protein genes. (a) Heatmap depicting the levels of genes influenced by control, nsp1, and nsp1-CD. MERS-CoV nsp1, nsp1-CD, or empty vector were transfected into HEK293T cells and harvested 24 h later. RNA samples were collected for RNA sequencing (n = 3 each group). (b and c) Volcano plot of differentially expressed mRNAs of nsp1 vs. control cells and nsp1-CD vs. vector control cells. (d and e) KEGG enrichment of mRNAs downregulated and upregulated by nsp1. (f and g) Real-time PCR quantification of mRNAs of ribosomal protein genes and mitochondrial protein genes in HEK293T cells transfected with control vector, nsp1, and nsp1-CD. (h) Real-time PCR quantification of mRNAs of DPP4 and AUP1. Data are mean ± s.d. from 3 independent experiments. *p < 0.05, **p < 0.01, ***p < 0.001, ****p < 0.001.
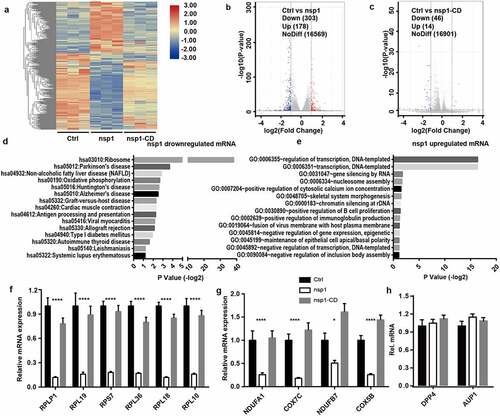
Figure 3. MERS-CoV nsp1 decreases ribosome number and disturbs mitochondrial function. (a) Ribosomes (right) and mitochondria (left) in HEK293T cells transfected with control vector, MERS-CoV nsp1, or nsp1-CD were assessed by electron microscopy. (b) The expression of nsp1 and β-actin in A549 cells was determined by Western blot. (c) Confocal microscopy of Mito-Tracker-Red in A549 cells transfected with control vector, MERS-CoV nsp1, and nsp1-CD. Nuclei were stained with DAPI. The images are representatives of at least three independent experiments. (d) Oxygen consumption rates (OCR) were measured in control vector-, MERS-CoV nsp1-, nsp1-CD-transfected A549 cells treated with oligomycin (1.5 μM), FCCP (1 μM), Rot & AA (0.5 μM). (e-g) Quantification of OCR-based basal respiration, ATP production, and spare respiration capacity analysis of control vector, nsp1, and nsp1-CD- transfected A549 cells. Data are mean ± s.d. from at three independent experiments. *p < 0.05, **p < 0.01.
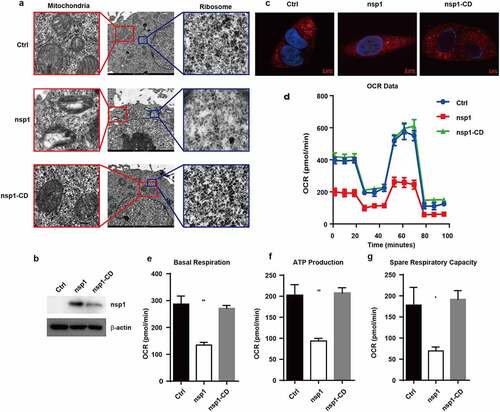
Figure 4. C1QBP can partially alleviate the inhibitory effect of nsp1 on GFP expression. (a) Heatmap depicting the levels of genes influenced by control vector, nsp1, and nsp1-CD (excluding ribosomal protein genes and mitochondrial protein genes). (b) Real-time PCR quantification of RPS18, CHCHD2, and C1QBP in HEK293T cells transfected by control vector, nsp1, and nsp1-CD. (c-d) Effects of CHCHD2 and C1QBP overexpression on recovering the expression of MERS-CoV nsp1-downregulated ribosomal and mitochondrial protein genes. HEK293T cells were co-transfected with control vector, nsp1, or nsp1-CD and CHCHD2 or C1QBP overexpression vectors respectively. Cells were collected after 36 h, and assayed by real-time PCR quantification. (e) Vector, nsp1, or nsp1-CD was transfected into HEK293T cells. 8 h later, these cells were incubated in the absence or presence of ActD. Intracellular RNAs were extracted at 36 h post transfection. (f) Vector or nsp1 was transfected into control or XRN1 knockdown HEK293T cells, the mRNA levels of RPS18 and COX4I1 were analyzed at 36 h post transfection. The expression of nsp1 and β-actin was determined by Western blot. The images are representatives of at least three independent experiments. Data are mean ± s.d. from 3 independent experiments. **p < 0.01, ***p < 0.001.
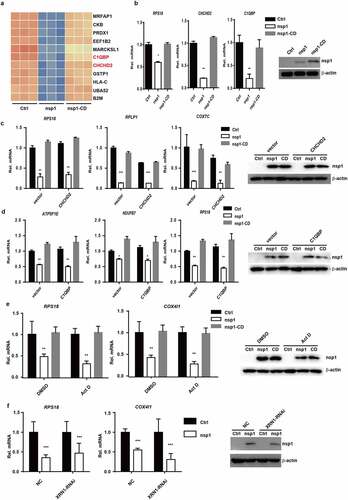
Figure 5. MERS-CoV nsp1 locates in a novel granules rich in the mRNAs of oxidative phosphorylation protein genes and ribosomal protein genes. (a) Confocal microscopy of the cellular localization of MERS-CoV nsp1. HEK293T cells were transfected with pcDNA3.1-nsp1, nsp1 antibody was used to detect the nsp1 expression. (b-c) Confocal microscopy was used to visualize the cellular localization of MERS-CoV nsp1. HEK293T cells were co-transfected with nsp1-GFP and (b) G3BP1-mCherry or (c) LSM14A-mCherry. 100 mM arsenite was used to trigger SGs formation. Nuclei were stained with DAPI. (d and e) Purification of nsp1-GFP granules by anti-GFP-beads. (d) Microscopy of nsp1-GFP granules in pre-sorted and sorted granules. (e) ImMunoblotting of nsp1-GFP granules in pre-sorted and sorted granules. (f) KEGG enrichment of P-body depleted mRNAs. (g) KEGG enrichment of stress granule-depleted mRNAs. (h) Molecular function, (i) biological process, and (j) cellular component terms of nsp1-located granule-enriched proteins. (k) RIP-qPCR analysis of COX4I1, RPS18, ATP5F1E, CHCHD2, and C1QBP. Representative figures of two independent replicates are shown. Data are mean ± s.d. from 3 independent experiments. *p < 0.05, **p < 0.01, ***p < 0.001.
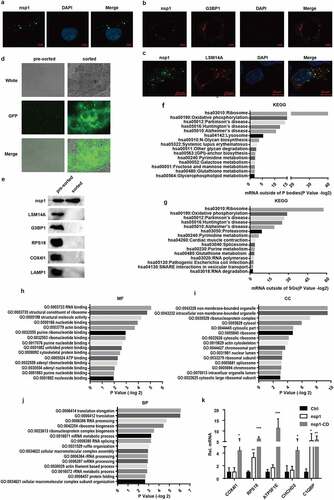
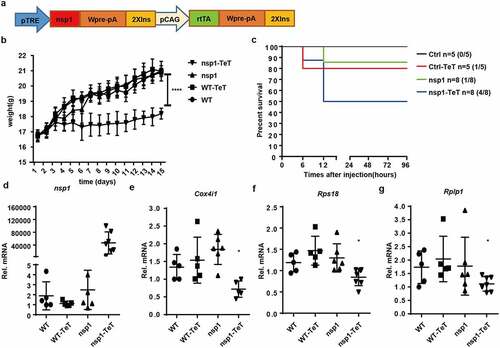
Figure 6. MERS-CoV nsp1 transgenic mice are more sensitive to poly(I:C)-induced death. (a) Design strategy of tetracycline-induced nsp1 transgenic mice. (b) WT and nsp1 transgenic mice of 4–5 weeks were fed with tetracycline or not, and the body weight was recorded once a day for 2 weeks. (c) Sex and age matched WT and nsp1 transgenic mice were fed tetracycline for 2 weeks and then injected intraperitoneally with poly(I:C) plus D-galactosamine. The survival of these mice was monitored every 12 h for 4 days. (d-g) Real-time PCR quantification of nsp1, Cox4i1, Rps18, and Rplp1 mRNAs in the lung tissues of WT and nsp1 mice. Data are representatives or mean± s.d.; n = 5 mice per group. *p < 0.05, **p < 0.01, ***p < 0.001, ****p < 0.001.
Supplemental Material
Download Zip (2.3 MB)Data availability statement
The authors confirm that the data supporting the findings of this study are available within the article and its supplementary materials