
Figures & data
Table 1. Primers used in this study
Figure 1. CSFV NS4B interacts with RPLP1.
(a-b) CSFV NS4B interacted with exogenous RPLP1. HEK-293 T cells were co-transfected with the indicated plasmid combinations or empty vectors for 48 h. NS4B-Flag or RPLP1-Myc were immunoprecipitated from cell lysates and their co-precipitated proteins were subjected to WB and detected with rabbit anti-Flag pAbs or rabbit anti-Myc pAbs. (c) CSFV NS4B bound to endogenous RPLP1. NS4B-Flag was transiently expressed in PK15 cells then immunoprecipitated with anti-Flag pAbs, co-precipitated endogenous RPLP1 was detected with rabbit anti-RPLP1 pAbs. (d) CSFV NS4B bound to the recombinant RPLP1. The GST-RPLP1 recombinant proteins were expressed in prokaryotic cells and purified with GST beads, then incubated with lysate of HEK-293 T cells expressing NS4B-Flag. After washed with cold-PBS, the eluted complexes were subjected to WB and detected with specific antibodies. (e) CSFV NS4B interacted with C-terminal RPLP1. HEK-293 T cells were co-transfected with the pcDNA3.1-NS4B-Flag and pEGFP-RPLP1 (1–114), pEGFP-RPLP1 (1–66) or pEGFP-RPLP1 (67–114) as indicated for 48 h. NS4B-Flag was immunoprecipitated from cell lysates and its co-precipitated GFP fusion proteins were detected with anti-GFP mAb. Left panel showed the schematic diagram of RPLP1 and its truncated constructs.
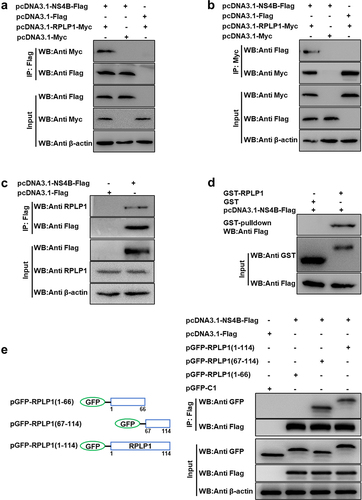
Figure 2. CSFV NS4B co-localizes with RPLP1.
(a) Representative confocal images of DsRed-RPLP1 and EGFP-NS4B in PK15 cells. PK15 cells were co-transfected with pEGFP-NS4B and pDsRed-RPLP1 in the absence (middle row) or presence (+ CSFV, bottom row) of CSFV infection. Cell nuclei were stained with DAPI, and pEGFP-C1 co-transfected with pDsRed-N1 served as negative control (top row). Scale bar equals to 5 μm. (b) Fluorescence correlation analysis results presented as Pearson’s correlation coefficient. The values were measured by Image-pro Plus software, and shown as mean ± SD of three individual pictures.
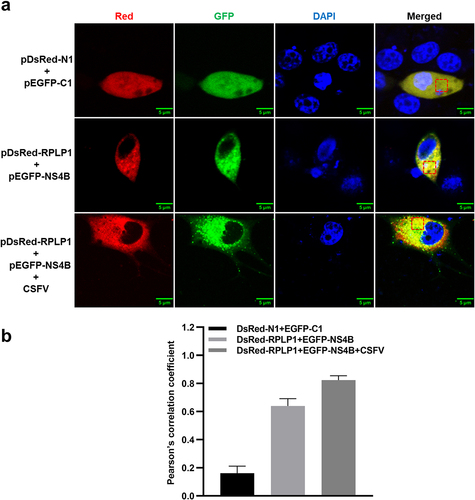
Figure 3. Knockdown of RPLP1 impairs CSFV infection.
(a) Confirmation the shRNAs against RPLP1 (Sh1, Sh2 and Sh3) and ShN expressing cell lines by detection of EGFP reporter. (b) Cell viability of RPLP1 knockdown or ShN cell lines was estimated by CCK-8. (c) The relative RPLP1 mRNA levels in RPLP1 knockdown cell lines were quantified by RT-qPCR. (d) The endogenous RPLP1 expression levels of RPLP1 knockdown cell lines were determined by WB and densitometry. The optical density ratio of RPLP1 to β-actin was calculated and the value of untransfected group (Mock) was normalized to 1.00. (e-g) Assessment of CSFV infection in RPLP1 knockdown or ShN cell lines. Cells were infected with CSFV (0.1 MOI) and collected at 24, 48, and 72 hpi for detection the viral RNA abundance, E2 protein expression, and progeny virus titers. (e) The relative CSFV RNA levels in RPLP1-Sh3 or ShN cell lines were quantified by RT-qPCR. (f) The CSFV E2 protein expression levels in RPLP1-Sh3 or ShN cell lines were determined by WB and densitometry. The optical density ratio of E2 protein to β-actin at each time points were calculated and the values of untransfected group (Mock) were normalized to 1.00. (g) The progeny CSFV titers in RPLP1-Sh3 or ShN cell lines were measured by IFA and expressed as TCID50/mL. (h) RPLP1-Sh3 or ShN cell lines were infected with CSFV (0.1 MOI) and the representative immunofluorescence images were captured at 24 hpi. Cell nuclei (blue) were labeled with DAPI, and the CSFV E2 proteins (red) were stained with mouse anti-E2 mAb. The infection rates for CSFV were shown below the images and calculated by quantifying the number of viral E2 expressing cells in total DAPI-staining cells. At least 500 cells for each sample in three independent experiments were counted using ImageJ software. All results are shown as the mean ± SD of three independent experiments. Student’s t-test: * (P < 0.05); ** (P < 0.01); *** (P < 0.001); **** (P < 0.0001); ns, not significant (P > 0.05).
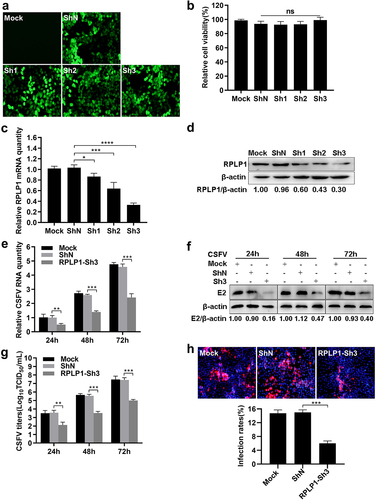
Figure 4. Overexpression of RPLP1 enhances CSFV proliferation.
(a) Confirmation the overexpression (CMV-RPLP1) and control (CMV) cell lines by detection of EGFP reporter. (b) Cell viability of RPLP1 overexpression cell lines was estimated by CCK-8. (c) The relative RPLP1 mRNA levels in RPLP1 overexpression cell lines were quantified by RT-qPCR. (d) The exogenous RPLP1 levels of RPLP1 overexpression cell lines were determined by WB and densitometry. The optical density ratio of RPLP1 to β-actin was calculated and normalized by the value of untransfected group (Mock). (e-g) Assessment of CSFV infection in RPLP1 overexpression cell lines. Cells were infected with CSFV (0.1 MOI) and collected at 24, 48, and 72 hpi for detection the viral RNA abundance, E2 protein expression, and progeny virus titers. (e) The relative CSFV RNA levels in RPLP1 overexpression cell lines were quantified by RT-qPCR. (f) The CSFV E2 protein expression levels in RPLP1 overexpression cell lines were determined by WB and densitometry. The optical density ratio of E2 protein to β-actin at each time points were measured and normalized by the values of untransfected group (Mock). (g) Progeny CSFV titers in RPLP1 overexpression cell lines were measured by IFA and expressed as TCID50/mL. (h) RPLP1 overexpression cell lines were infected with CSFV (0.1 MOI) and the representative immunofluorescence images were captured at 24 hpi. Cell nuclei (blue) were labeled with DAPI, and the CSFV E2 proteins (red) were stained with mouse anti-E2 mAb. The infection rate for CSFV was shown below the images, calculated by quantifying the number ratio of viral E2 positive cells in total DAPI-staining cells. At least 500 cells for each sample from three independent experiments were counted using ImageJ software. (i) The PK15 cells transiently transfected with pEGFP-RPLP1 (1–114), pEGFP-RPLP1 (1–66) or pEGFP-RPLP1 (67–114) for 36 h were infected with CSFV (0.1 MOI) and collected at 24, 48, and 72 hpi for detection the progeny virus titers. All results are shown as the mean ± SD of three independent experiments. Student’s t-test: ** (P < 0.01); *** (P < 0.001); ns (P > 0.05)
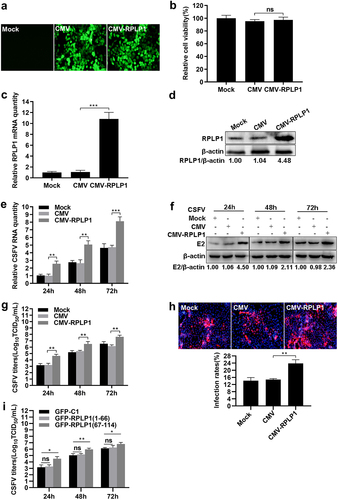
Figure 5. CSFV infection upregulates the expression of RPLP1.
PK15 cells were infected with 5 MOI of CSFV (or not infected) at 37°C for 1 h, followed by adding fresh medium. The cells were harvested at indicated time points (0, 24, 48, and 72 hpi). (a) The CSFV genome copies in PK15 cells were quantified at indicated time points by RT-qPCR. (b) The relative RPLP1 mRNA levels in PK15 cells were quantified by RT-qPCR and normalized to β-actin. (c) The CSFV E2 and RPLP1 protein levels in PK15 cells were detected by WB. (d) The RPLP1 protein levels in PK15 cells were analyzed by densitometry. The optical density ratio of RPLP1 to β-actin was calculated and the value of uninfected group (0 h) was normalized to 1.00. All results are shown as mean ± SD of three independent experiments. Student’s t-test: ** (P < 0.01); *** (P < 0.001); **** (P < 0.0001); ns (P > 0.05).
Figure 6. RPLP1 and NS4B take no significant effect on CSFV IRES activity.
(a) Activity of CSFV IRES was detected by dual-luciferase reporter assay. In the upper part, constructs used for the assay were shown, including a CSFV IRES mediated firefly luciferase expression plasmid (pGL4.21-IRES) and a plasmid constitutively expressing renilla luciferase (pGL4.74), with a firefly luciferase plasmid lacking promoter used for control (pGL4.21). Luc2P: firefly luciferase, hRluc: synthetic renilla luciferase. In the lower part, the activity of CSFV IRES was quantified by measuring the activity ratio of firefly luciferase and co-transfected renilla luciferase (Firefly/Renilla). (b) Activity of CSFV IRES in cells with and without RPLP1 knockdown. The activity of CSFV IRES in cell lines stably expressing RPLP1-Sh3 (knockdown) or ShN (control) was measured as in a, and the IRES activity showed no significant difference with and without RPLP1 knockdown. (c) Verification the expression levels of RPLP1 and eEF1A in RPLP1 or eEF1A overexpression cell lines by WB and densitometry. (d) Activity of CSFV IRES in RPLP1 overexpression cells. Overexpression of eEF1A which suppresses IRES activity served as a control. (e) Verification the expression levels of NS4B and NS5A in PK15 cells at 36 hpt by WB. (f) Activity of CSFV IRES in NS4B and NS5A overexpression PK15 cells were detected, and the latter served as a positive control. (g) Verification the expression levels of NS4B and RPLP1 in RPLP1 overexpression cell lines at 36 hpt by WB. (h) Activity of CSFV IRES in NS4B and RPLP1 co-overexpression PK15 cells. All the results are shown as the mean ± SD of three independent experiments. Student’s t-test: ** (P < 0.01); *** (P < 0.001); **** (P < 0.0001); ns (P > 0.05).
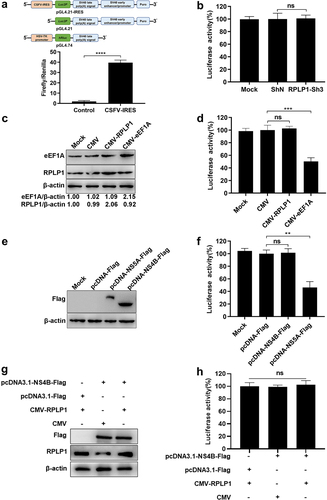
Figure 7. RPLP1 is essential for translation of CSFV RNA.
(a) The relative CSFV RNA levels was quantified at binding and entry steps. For binding assay, ShN or RPLP1-Sh3 cell lines were inoculated with 1 MOI of CSFV at 4°C for 1 h, unadsorbed virions were washed off and then the cells were harvested to detect the cell-bound viruses using RT-qPCR. For entry assay, after the binding step, cells were transferred to 37°C for 1 h to let the virus internalize, then washed and harvested for viral RNA quantification. (b) Extracellular viral titers were measured in the first round of life cycle (10 hpi). In comparison to the control (ShN and mock), RPLP1 knockdown (RPLP1-Sh3) reduced the extracellular viral titer significantly. (c) Intracellular CSFV genome copies were measured in the first round of virus life cycle (10 hpi), and no difference was observed with (RPLP1-Sh3) and without (ShN and mock) knockdown of RPLP1. (d) Intracellular viral titers were measured at 10 hpi. Knockdown of RPLP1 (RPLP1-Sh3) significantly reduced infectious viral titers, suggesting that RPLP1 facilitate production of infectious virions in the cell. (e) Total cellular protein synthesis was quantified by incorporation of OPP. While incorporation of OPP was blocked by cycloheximide (CHX) as it suppressed translation of all mRNAs (CHX+OPP), RPLP1 knockdown did not affect global protein translation as there was no difference between the RPLP1 knockdown (RPLP1-Sh3) and control (ShN). (f) The CSFV E2 protein expression levels were evaluated by WB and densitometry. RPLP1-Sh3 and ShN cell lines treated with 100 μg/mL CHX starting 0.5 h before CSFV infection were used as translation inhibition control. The optical density ratio of E2 protein to β-actin were calculated and the values of control group (ShN) were normalized to 1.00. All the results are shown as the mean ± SD of three independent experiments. Student’s t-test: ** (P < 0.01); *** (P < 0.001); ns (P > 0.05).
Data availability statement
The data that support the findings of this study are available from the corresponding author, W. D., upon reasonable request.