
Figures & data
Table 1. Primers for qRT-PCR
Table 2. Antifungal activities of SH and FLU against Candida albicans and Candida glabrata single/dual biofilms
Figure 1. SH and FLU are synergistic against the dual C. albicans and C. glabrata biofilms through inhibiting filamentation in vitro. A. The drugs inhibit the single and dual fungal growth in the mixed biofilms by cell counting. B. The drugs reduce the biomass of the mixed fungal biofilms by CV staining. C. The drugs inhibit the metabolism of the mixed fungal biofilms by intracellular cAMP determination. The final concentrations of SH and FLU are at 8 and 64 μg/mL in A-C. D. Filamentation of the mixed fungal biofilms can be abolished by (a1-e1) 8 μg/mL SH and/or 64 μg/mL FLU after 8 h of co-cultivation and (a2-e2) 32 μg/mL SH and/or 256 μg/mL FLU for 4.5 h of co-cultivation after 1.5 h of drug-free pre-growth, and compensated by db-cAMP at 5 mM in a liquid Spider medium. The fungal cell with germ tube is defined as that described in the Materials and Methods. The histogram is the analysis of 100 fungal cells in three different occasions. Scale bar: 50 μm. E. Mycelium of the mixed fungi can be abrogated by (a1-e1) 64 μg/mL SH and/or 1 μg/mL FLU after 50 h of co-growth and (a2-e2) 128 μg/mL SH and/or 2 μg/mL FLU for 40 h of co-cultivation after 8 h of drug-free pre-incubation, and compensated by db-cAMP at 5 mM in a solid embedded agar condition. Scale bar: 100 μm. * p < 0.05, ** p < 0.01, *** p < 0.001. Fungi: C. albicans SC5314 and C. glabrata ATCC15126.
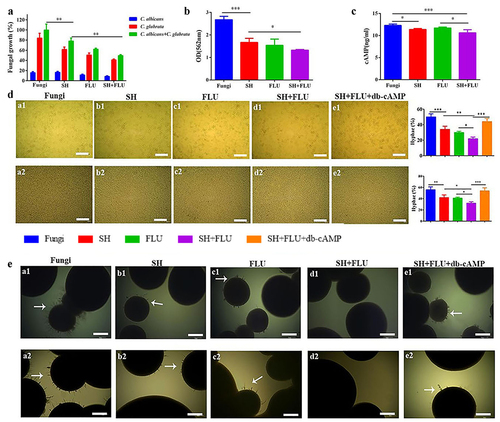
Figure 2. SH and/or FLU can protect the mice from OPC caused by C. albicans SC5314 and C. glabrata ATCC15126. A. Scheme of experimental design. B. Body weight assessment of mice. C. Changes of oral fungal burden (n = 3). D. Fungal capacities of liver, spleen, kidney, stomach and colon (n = 7). E. Examination of fungal colonization and penetration of infected mucosal tongue tissues by periodic acid Schiff (PAS) staining. Scale bar: 50 μm. * p < 0.05, ** p < 0.01, *** p < 0.001.
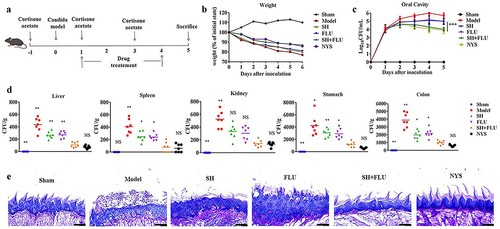
Figure 3. SH and/or FLU affect HIF-1α/IL-17 axis in the OPC model induced by C. albicans SC5314 and C. glabrata ATCC15126. A. SH and/or FLU depress the dual fungal biofilms (stained by CFW, blue) associated hypoxic microenvironment (stained by HypoxyprobeTM, green) in the oral mucosal surface of OPC mice. Scale bar: 50 μm. B. SH and/or FLU downregulate the mRNA expressions of hif-1α, il-23, il-17a and il-17ra mRNA in vivo. * p < 0.05, ** p < 0.01, *** p < 0.001.
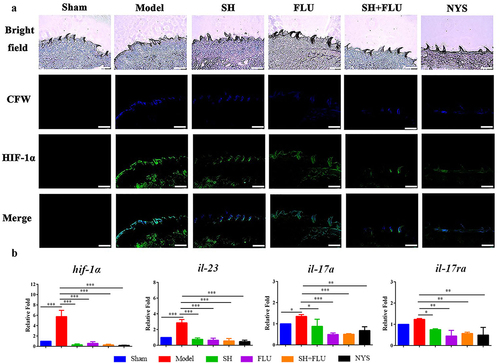
Figure 4. SH and/or FLU inhibit the mixed fungal biofilms via the regulation of HIF-1α/IL-17 axis in EC109. A. Representative fluorescent images of EC109 cells in the dark (a1-e1) and bright (a2-e2) fields show an inhibition of the drug combination on fungal colonization induced hypoxia stained by HypoxyprobeTM−1. a1-a2, EC109; b1-b2, EC109+ Fungi; c1-c2, EC109+ Fungi+SH; d1-d2, EC109+ Fungi+FLU; e1-e2, EC109+ Fungi+SH+FLU; Scale bar: 50 μm. B. Representative flow cytometry profiles and analysis of EC109 cells labeled by FITC-HypoxyprobeTM−1 reveal a decrease of hypoxic EC109 after drug combination. The fluorescent intensity of each representative profile is marked top right. C. Representative Western blot bands and quantitative analysis exhibit a reduction of HIF-1α protein by SH and/or FLU in EC109. D. SH and/or FLU can make a downregulation of il-17a mRNA expression in EC109. E. SH and/or FLU can cause a decline of fungal growth after the incubation with EC109. The experimental methods of C-E are the same as those described in A. * p < 0.05, ** p < 0.01, *** p < 0.001. Fungi: C. albicans SC5314 and C. glabrata ATCC15126.
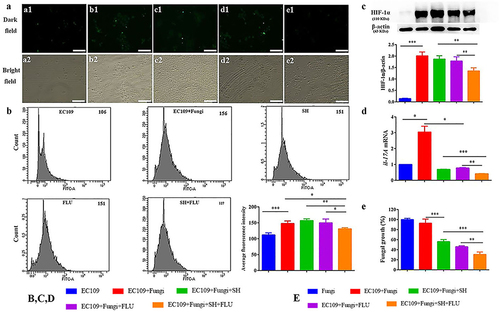
Figure 5. Inhibition of the mixed fungal co-cultures by SH plus FLU is indirectly associated with the regulation of the HIF-1α/IL-17 axis in EC109 cells treated with YC-1 or IL-17A. A, E. Representative fluorescent images of EC109 cells stained by HypoxyprobeTM−1 in the dark (a1-f1) and bright (a2-f2) fields show a synergistic inhibition of YC-1 (HIF-1α inhibitor)/IL-17A and the drug combination on fungal colonization induced hypoxia. a1-a2, EC109; b1-b2, EC109+ YC-1/IL-17A; c1-c2, EC109+ Fungi; d1-d2, EC109+ YC-1/IL-17A +Fungi; e1-e2, EC109+ Fungi+SH+FLU; f1-f2, EC109+ YC-1/IL-17A +Fungi+SH+FLU. Scale bar: 50 μm. B, F. Representative Western blot bands and quantitative analysis exhibit a synergistic inhibition of YC-1/IL-17A and SH plus FLU on HIF-1α protein in EC109 cells. C. YC-1 promotes the inhibitory effect of SH plus FLU on il-17a mRNA expression in EC109 cells. D, G. The mixed fungal growth can be restrained with the treatments of YC-1/IL-17A and SH plus FLU. * p < 0.05, ** p < 0.01, *** p < 0.001. Fungi: C. albicans SC5314 and C. glabrata ATCC15126.
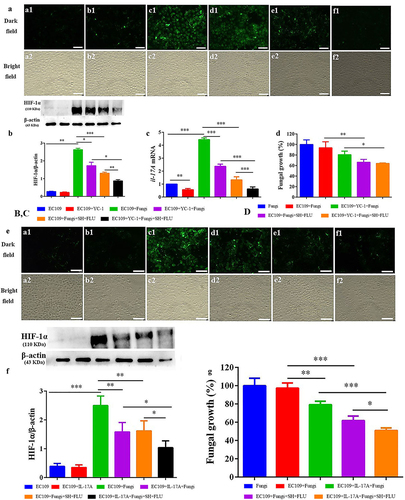
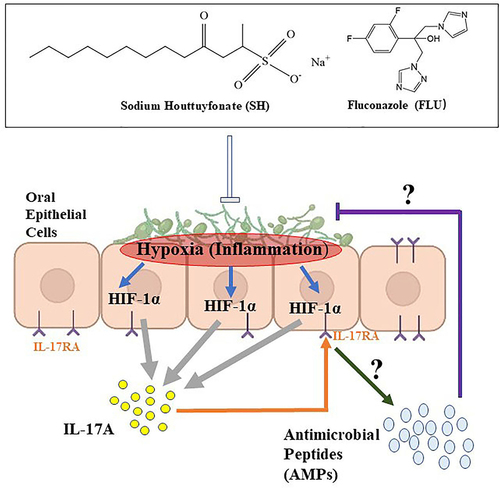
Figure 6. Summarized findings of this work.
Supplemental Material
Download MS Word (3.1 MB)Data availability statement
The data and materials that support the results or analyses presented in this study are available from the corresponding author on reasonable request.