
Figures & data
Table 1. Isolation of NDVs from multiple avian species at LPMs and lake wetlands in China from January 2016 to March 2017
Figure 1. Maximum likelihood phylogenetic tree based on the complete F gene nucleotide sequences. All available GenBank complete F gene (1662 nt) sequences (n = 3338) were used to construct ML tree. The scale bar represents the number of nucleotide substitutions per site. A, Newcastle disease viruses isolated from different geographical regions and hosts are distinguished by colors, meanwhile the strains isolated in this study were marked with a dashed box (vaccine strains not included). B, C, magnification of ML tree of class II genotype I and class I sub-genotype 1.1.2, respectively. The isolates in this study and its’ closer reference strains are highlighted. The branches are colored according to the location on which the virus was isolated. The isolates from wild birds are marked by green birds and only the bootstrap value greater than 60% is shown.
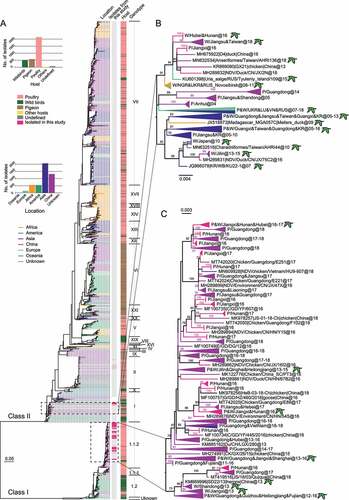
Figure 2. Ancestral dating of class I and class II NDVs a, c, Root-to-tip regression for both class I (A, n = 505) and class II (C, n = 1474) datasets to detect the temporal signals. CC stands for central China; b, d, the MCC tree of class I (b) and class II (d) NDVs. The isolates in this study are marked in rose, and the time of the MRCA of the strains is marked with a rose or blue arrow. P for poultry, W for wild birds.
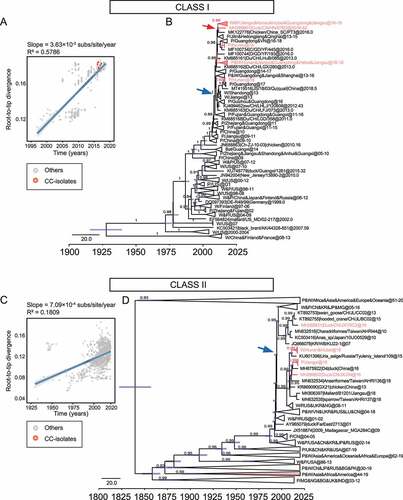
Figure 3. Evolutionary rate and population dynamics of NDV a, Estimated molecular evolutionary rate of NDV; b, Bayesian skyline plot of class I virus, showing effective population size as a function of time. The light blue area represents the 95% confidence intervals of HPD analysis.
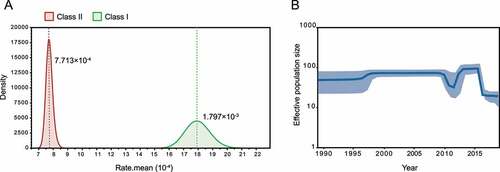
Figure 4. Estimated transmission route of class I NDV Transmission map was drawn based on available NDV with complete sampling information. a, Routes of class I NDV transmission worldwide. The green, lemon-yellow and purple lines represent the transmission from the United States, Finland and China respectively; b, Circulation of NDVs across geographic subdivisions of China rather than between provinces and cities. The number of isolates and the host information are represented as pie charts, and the different colors of the dashed lines represent the values of Bayes factor (BF).
Figure 5. Genomic variations of the class I NDV a, Average sequencing depth of class I NDV samples (ordinate scaled by 600x); b, SNP distributions in class I NDV genomes: magenta for synonymous (s), dark blue for non-synonymous (NS), gray for UTR, and cyan for IG; c-e, Types and distribution statistics of SNPs.
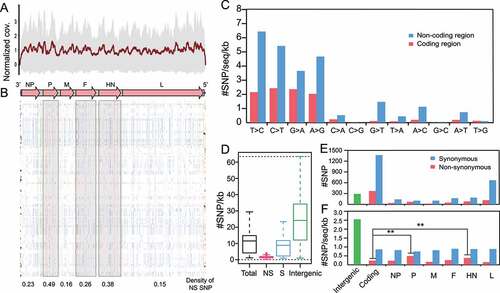
Figure 6. iSNV distributions along the genome of class I NDV a, #iSNV/kb versus mean sequencing depth for each site over NDV genomes. Dashed line shows the linear regression; b, Histogram of iSNVs; c, Statistics of shared iSNV sites; d,e, Total iSNV numbers (d), and #iSNV/kb values (e) along NDV genomic regions and ORF regions; f,g, Distributions of iSNV sites at codon positons (f), and type of iSNVs in each ORF (g). The observed numbers for each ORF are compared with all ORFs (two-tailed Fisher’s exact test for a 2 × 3 or one-tailed 2 × 2 contingency table); h, The variation type of substitutions in coding and non-coding regions; I-J, Mean allele frequency of each substitution.
Table 2. Potential positive selection sites for HN and F proteins under multiple models