
Figures & data
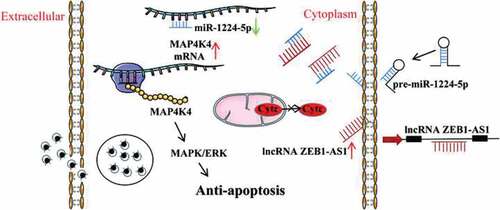
Figure 1. LncRNA ZEB1-AS1 was up-regulated in HeLa cells by persistent C. trachomatis infection. (a) Characterization of persistent C. trachomatis infection. the persistent infection group was cultured with IFN-γ (75 U/mL) after infection under the same conditions, whereas the acute infection group was not treated with IFN-γ. the inclusions in cells were mixed and detected by transmission electron microscopy; the elementary body was indicated by the black arrow, the reticulate body was indicated by gray arrow, abnormal body was indicated by white arrow, scale bar = 2um. (b) Heatmap of ZEB1-AS1 expression levels between the 12 hpi groups, the 24 hpi groups, the 40 hpi groups and the control groups in microarray data. the pink color indicates a relatively higher expression, whereas the blue indicates a relatively lower expression. (c) Validate the expression levels of ZEB1-AS1 in the microarray data using qRT-PCR. All data were presented as mean ± standard deviation (SD). *, P <.05.
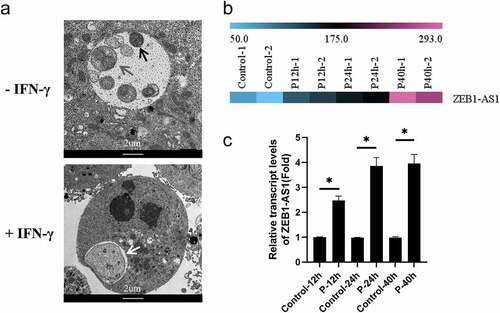
Figure 2. LncRNA ZEB1-AS1 was mainly located in the cytoplasm in HeLa cells. (a) the lncATLAS platform predicted the distribution of ZEB1-AS1 in HeLa cells. (b) the localization of ZEB1-AS1 in HeLa cells was examined by RNA-FISH. ZEB1-AS1 probes were labeled with cy3, scale bar = 10um.
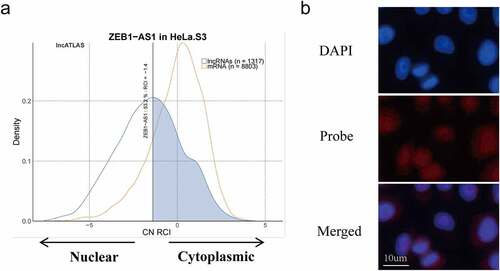
Figure 3. LncRNA ZEB1-AS1 expression could affect persistent C. trachomatis infection-induced antiapoptosis. (a) qRT-PCR was used to detect the effect of ZEB1-AS1 interference by siRNA. 18S rRNA was used as the internal control. (b) the apoptotic rate was detected by Hoechst staining (400×), HeLa cells were treated with siRNA for 24 h and followed by persistent infection. (c) the apoptosis rate was calculated by the Hoechst staining experiment. (d) the apoptotic rate was detected by FCM. (e) the fluorescence intensity of JC-1 in mitochondria was observed by fluorescence microscopy; the positive control group was treated with 10 μM CCCP for 20 min before detection; HeLa cells were treated with siZEB1-AS1 for 24 h and then were followed persistent infection, scale bar = 10um. (f) Cytochrome c fluorescent intensity per cell was assayed by fluorescence microscope, scale bar = 10um. (g, h, i) the indicated protein levels of Bax, Bcl-2, and cleaved caspase 3 were analyzed by western blot. All data were presented as mean ± standard deviation (SD), *, P <.05, **, P <.01.
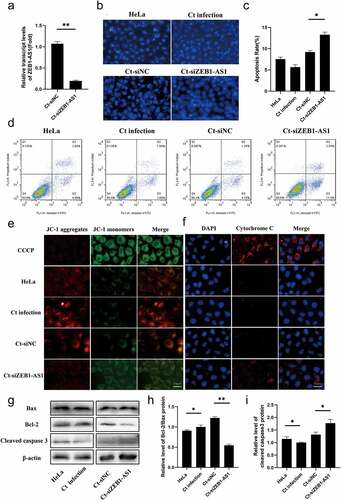
Figure 4. miR-1224-5p was a target of lncRNA ZEB1-AS1, and MAP4K4 was a direct target gene of miR-1224-5p in persistent C. trachomatis infected HeLa cells. (a) the Venn diagram showed that Lncbase, ENCORI, and miRDB platforms predicted lncRNA-targeted miRnas. (b) Heatmap of MAP4K4 expression levels between the 12 hpi groups, the 24 hpi groups, the 40 hpi groups, and the control groups in microarray data. the pink color indicates a relatively higher expression, whereas the blue indicates a relatively lower expression. Validate the expression levels of MAP4K4 in the microarray data using qRT-PCR. All data were representative of three independent experiments. (c) the binding sites of miR-1224-5p and ZEB1-AS1 or MAP4K4. (d) qRT-PCR was used to validate the effect of miR-1224-5p expression by miR-1224-5p mimic or inhibitor. U6 was used as the internal control. (e) the luciferase reporter gene assay verified the correlation between miR-1224-5p and ZEB1-AS1. (f) the luciferase reporter gene assay confirmed the correlation between miR-1224-5p and MAP4K4. (g) the expression of miR-1224-5p was detected in the HeLa group, persistent infection group, Ct-siNC group, and Ct-siZEB1-AS1 group by qRT-PCR. (h) the expression of MAP4K4 was detected in Ct-miR-NC mimic group, Ct-miR-1224-5p mimic group, Ct-siNC group, and Ct-siZEB1-AS1 group by qRT-PCR. (i, j) Western blot assays were conducted to explore the effects of ZEB1-AS1 and miR-1224-5p in MAP4K4 expression in persistent infection cells. All data were presented as mean ± standard deviation (SD), *, P <.05, **, P <.01, NS, no significance.
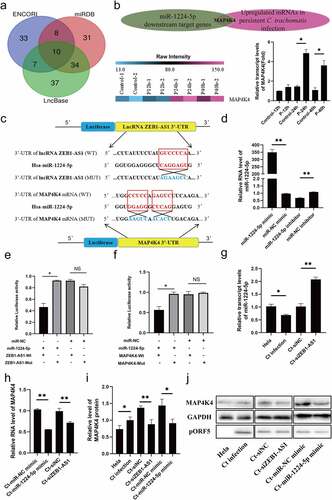
Figure 5. miR-1224-5p and MAP4K4 were involved in the antiapoptosis of persistent C. trachomatis infection. (a) the apoptotic rate was detected by Hoechst staining (200×) and FCM, HeLa cells were transfected with miR-1224-5p mimic or miR-NC mimic for 24 h and then were followed persistent infection. the apoptosis rate was calculated by the Hoechst staining experiment. (b) qRT-PCR was used to validate the effect of MAP4K4 expression by siRNA. 18S rRNA was used as the internal control. (c) the apoptotic rate was detected by Hoechst staining (200×) and FCM, HeLa cells were transfected with siMAP4K4 or siNC for 24 h and then were followed persistent infection. the apoptosis rate was calculated by the Hoechst staining experiment. (d, e, f) the indicated protein levels of Bax, Bcl-2, and cleaved caspase 3 were analyzed by western blot, the gray values of protein bands were quantified by Image J. (g) the fluorescence intensity of JC-1 in mitochondria was observed by fluorescence microscopy, HeLa cells were treated with miR-1224-5p mimic or siMAP4K4 for 24 h and then were followed persistent infection, scale bar = 10um. (h) Cytochrome c fluorescent intensity per cell was assayed by fluorescence microscope, scale bar = 10um. All data were presented as mean ± standard deviation (SD), *, P <.05, **, P <.01.
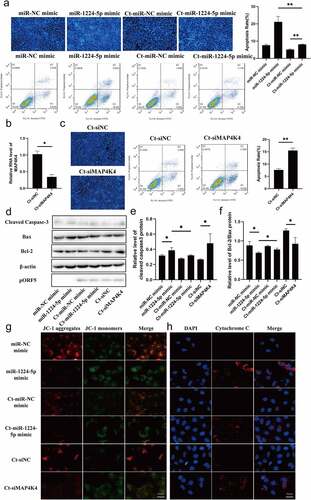
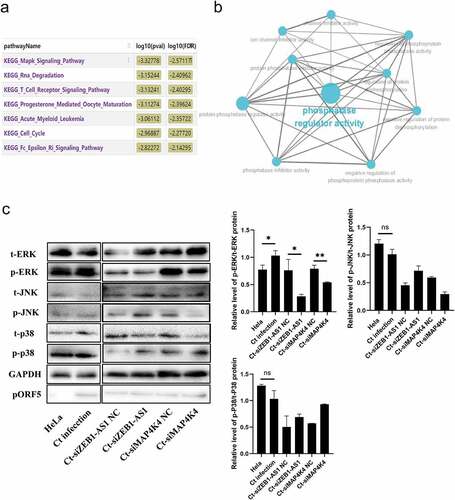
Figure 6. LncRNA ZEB1-AS1 and MAP4K4 activated the MAPK/ERK pathway in persistent C. trachomatis infection. (a) Bioinformatics analysis of the enrichment pathway of ZEB1-AS1 co-expressed mRnas. (b) GO enrichment of ZEB1-AS1-targeted mRnas. the blue dots represent related biological processes. (c) the p-ERK, t-ERK, p-JNK, t-JNK, p-p38, and t-p38 protein expressions were evaluated using western blot in persistent infection cells with different transfection molecules. the gray values of protein bands were quantified by Image J. All data were presented as mean ± standard deviation (SD), *, P <.05, NS, no significance.
Supplemental Material
Download MS Word (14.9 KB)Data availability statement
The data that support the findings of this study are available from the corresponding author upon reasonable request.