
Figures & data
Table 1. List of primers used in this study
Figure 1. BoHV-1 infection upregulates the expression of DDIT3. MDBK cells were infected with BoHV-1 (MOI =0 .1) for the indicated times. (a) Total RNA was harvested to detect the mRNA levels of DDIT3 by qPCR. Means and SD from three independent experiments are shown. **, P < 0.01. (b) DDIT3, PERK, and p-PERK in the total lysates were analyzed by immunoblot analysis at the indicated times. Three replicates were performed for this analysis. (c) MDBK cells were infected with BoHV-1 (MOI = 0.1) for 12 hours. The cells were stained with anti-gB (the BoHV-1 glycoprotein gB) and anti-DDIT3 monoclonal antibodies, and fluorescence images were obtained with confocal microscopy. Bar = 40 μm. (d) Magnified images of the white boxed area in (c). Bar = 5 μm. (e) Thirty-six hours after NC- or DDIT3-overexpressing cells were transfected with siCon or siPERK, the cells were infected with BoHV-1 (MOI =0 .1), and these experiments were conducted three times. Then the cells were harvested at 24 hpi for immunoblot analysis.
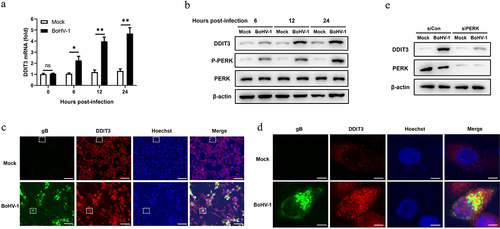
Figure 2. DDIT3 promotes BoHV-1 replication. (a) Immunoblot analysis of DDIT3 expression in DDIT3-overexpressing MDBK cells. The CCK-8 assay was used to assess cell viability in DDIT3-overexpressing cell lines. (b,c) DDIT3-overexpressing stable cell lines or negative-control (NC) MDBK cell lines were infected with BoHV-1 (MOI =0 .1) and harvested at 12 and 24 hpi for BoHV-1 gC gene expression and virus titration analyses. Relative levels of BoHV-1 gC mRNA were normalized to β-actin; the fold change was determined by setting the NC group in one of three repeated experiments as 1. (d) Knockdown efficiencies of DDIT3-targeting shrnas in stable MDBK cell lines were assessed by immunoblot analysis. The CCK-8 assay was conducted to determine the cell growth of DDIT3 knockdown cell lines. (e) qPCR analysis of BoHV-1 gC gene expression in stable DDIT3-knockdown cell lines at 12 and 24 hpi. (f) DDIT3-knockdown MDBK cell lines and the corresponding control groups were infected with BoHV-1 (MOI =0 .1) for 12 and 24 hours, and titers of BoHV-1-infected cells were determined.
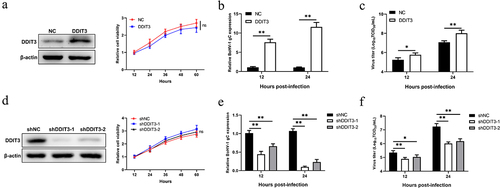
Figure 3. DDIT3 restrains the antiviral innate immune response during BoHV-1 infection. (a,b) qPCR analysis of IFN-β, IFIT1, MX1, and ISG15 mRNA levels in DDIT3-overexpressing MDBK cells infected with BoHV-1 (MOI = 0.1) for 12 hours. Immunoblot analysis of ISG15 and IFIT1 expression in DDIT3-overexpressing MDBK cells infected with BoHV-1. (c,d) qPCR analysis of IFN-β, IFIT1, MX1, and ISG15 mRNA levels in DDIT3 knockdown cells infected with BoHV-1 (MOI = 0.1) for 12 hours. Relative IFN-β and ISG mRNA levels were normalized to β-actin; fold change was determined by setting the NC group at 12 hpi in one of three repeated experiments as 1. The means and SD from three independent experiments are shown. **, P < 0.01; ns, not significant. Immunoblot analysis of ISG15 and IFIT1 expression in DDIT3-knockdown MDBK cells infected with BoHV-1. (e) qPCR analysis of the silencing efficiency of IFNAR1 in MDBK cells at 36 hpi. (f and g) After transfection of si-NC or si-IFNAR1 for 36 hours, MDBK cells were infected with BoHV-1 (MOI =0 .1) and harvested at 24 hpi for BoHV-1 gC gene expression and virus titration analyses.
Figure 4. DDIT3 targets STING to inhibit the innate immune response. (a) IFN-β mRNA levels in cells transfected with expression plasmids for cGAS+ STING, TBK1 or IRF3-5D along with the control or DDIT3 vector for 24 hours. (b) Luciferase (Luc) activity of the IFN-β promoter reporter in HEK293 cells co-transfected with expression plasmids for cGAS+ STING, TBK1 or IRF3-5D together with the control or DDIT3 vector. (c) Immunoblot analysis of cGAS and STING protein levels in negative-control (NC) and DDIT3-overexpressing MDBK cells infected with BoHV-1 (MOI =0 .1). Relative densitometry of each band was performed by measuring band intensity with AlphaView software version 3.4. Graphs on the right show quantification of western blot data from three independent experiments. (d) Immunoblot analysis of cGAS and STING protein levels in DDIT3-knockdown or shNC-transfected MDBK cells infected with BoHV-1 (MOI =0 .1). Densitometry of each band was performed by measuring band intensity with AlphaView software. Experiments were repeated three times. (e, f) Immunoblot analysis of STING levels in DDIT3-overexpressing MDBK cells pretreated with MG132 (0.5 mM) or 3-MA (2 mM) followed by infection with BoHV-1 (MOI = 0.1) for 24 hours. the western blot experiment was repeated independently three times with similar results.
Figure 5. SQSTM1 promotes BoHV-1 replication by inhibiting IFN antiviral responses. (a) Immunoblot analysis of the indicated protein in NC- and DDIT3-overexpressing MDBK cells infected with BoHV-1 (MOI = 0.1). Three replicates were used for immunoblot analysis. (b) Immunoblot analysis of the SQSTM1 protein in SQSTM1-overexpressing or empty retrovirus-transduced MDBK cells. (c) qPCR analysis of IFN-β and MX1 mRNA levels in DDIT3-overexpressing or control cells infected with BoHV-1 (MOI = 0.1). (d) DDIT3-overexpressing cells were infected with BoHV-1 (MOI = 0.1) and harvested for viral gC gene expression analyses and virus titration analyses. (e) The silencing efficiency of siRNA targeting SQSTM1 in MDBK cells was measured by qPCR and immunoblotting. CCK-8 assays were used to measure the viability of cells after siRNA transfection. (f) qPCR analysis of IFN-β and MX1 mRNA levels in DDIT3-knockdown cells infected with BoHV-1 (MOI =0 .1). (g) DDIT3-knockdown cells were infected with BoHV-1 and harvested at 12 and 24 hpi for gC gene expression and virus titration analyses. (h) The knockdown efficiency of siRNA targeting ATG5 in MDBK cells was assessed by immunoblotting. The viability of MDBK cells after MDBK transfection with siRNA was assessed by CCK-8 assays. (i) At 36 h after siATG5 transfection, MDBK cells infected with BoHV-1 (MOI = 0.1) were harvested for qPCR and virus titration. The means and SD from three independent experiments are shown. **, P <0 .01; ns, not significant.
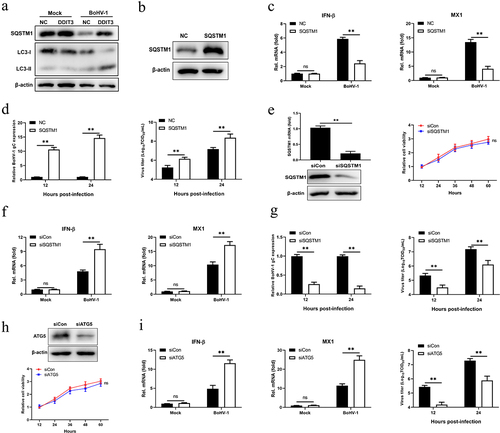
Figure 6. SQSTM1 inhibits innate immunity by promoting STING degradation in MDBK cells. (a) Immunoblot analysis of SQSTM1 and STING protein levels in NC- and DDIT3-overexpressing MDBK cells infected with BoHV-1 (MOI = 0.1), experiments were conducted three times. (b) At 48 hours post-transfection with si-Con or si-SQSTM1, MDBK cells were infected with BoHV-1 (MOI = 0.1) and harvested at 24 hpi for immunoblot analysis. Graphs on the right show quantification of western blot data from three independent experiments. Relative intensity was quantified and analyzed based on densitometry using AlphaView software. (c) Coimmunoprecipitation and immunoblot analysis of extracts of 293T cells transfected with Flag-SQSTM1 and HA-EV or HA-STING. (d) Confocal microscopy analysis of colocalization of bovine SQSTM1 and bovine STING. HEK 293T cells transfected with Flag-SQSTM1 and HA-STING were subjected to immunofluorescence analysis using Flag- and HA-specific antibodies. Bar = 5 μm. (e, f, and g) Thirty-six hours after NC- or DDIT3-overexpressing cells were transfected with si-Con or si-SQSTM1, the cells were infected with BoHV-1 (MOI =0 .1) and harvested at 24 hpi for immunoblot analysis (e), qPCR (f) or virus titration (g). (h, i, and j) At 36 h after siATG5 transfection, DDIT3-overexpressing and control cells were infected with BoHV-1 (MOI = 0.1), and the cells were harvested at 24 hpi for immunoblot analysis (h), qPCR (i) or virus titration (j). For E and H, the western blot experiment was repeated independently three times with similar results. The means and SD from three independent experiments are shown. **, P < 0.01; ns, not significant.
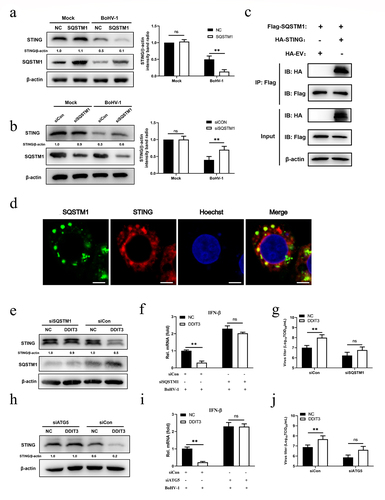
Figure 7. The increase in SQSTM1 expression is DDIT3 dependent in MDBK cells. (a) qPCR analysis of SQSTM1 mRNA levels in DDIT3-overexpressing or control cells infected with BoHV-1 (MOI =0 .1) at 12 and 24 hpi. (b) qPCR analysis of SQSTM1 mRNA levels in DDIT3 knockdown cells at 12 and 24 h after BoHV-1 infection (MOI =0 .1). (c, d) HEK293T cells were co-transfected with a series of truncated SQSTM1 promoter constructs (M1 to M8) (c) together with a Renilla luciferase reporter vector and analyzed for dual luciferase activity (d). (e) Immunoblot analysis of bovine DDIT3 and mutants in HEK293T cells. (f) Expression of luciferase (Luc) activity of the SQSTM1 promoter (M6) reporter in HEK293 cells co-transfected with DDIT3 or mutants together with the pRL-TK-luc vector. The means and SD from three independent experiments are shown. **, P <0 .01; *, P < 0.05; ns, not significant. (g) At 36 h after siPERK transfection, MDBK cells were infected with BoHV-1 (MOI =0 .1), and the cells were harvested at 24 hpi for immunoblot analysis.
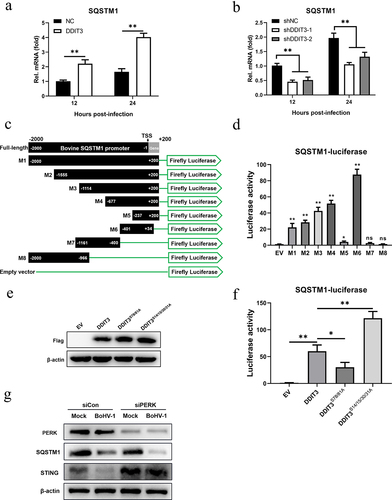
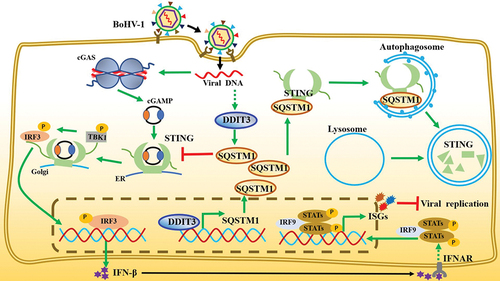
Figure 8. Model depicting the mechanism by which DDIT3-SQSTM1-STING pathway activation promotes BoHV-1 infection. BoHV-1 infection-induced upregulation of DDIT3 expression increases SQSTM1 expression by transcriptional activity. SQSTM1 promotes the autophagic degradation of STING, thereby blocking signal transmission by the cGAS-STING pathway and inhibiting the expression of IFN-I and ISGs.
Data availability statement
The data that support the findings of this study are available from the corresponding author Hongmei Wang or Honbin He.