
Figures & data
Figure 1. The hbl operon of B. cereus strain F837/76. The operon consists of the genes hblC, D, A and B, encoding the proteins Hbl L2, L1, B and B,’ respectively [Citation28,Citation32]. hblC and D are separated by 61, hblD and A by 36 bp. Between hblA and B is a space of 402 bp. Upstream and downstream of hblB, a stem loop has been detected [Citation9]. The promoter of the hblCDA operon is shown, including the transcription start TAA [Citation33]. 236 bp upstream of the promoter, a binding box of the global regulator protein PlcR has been identified [Citation34]. The figure was adapted from Dietrich et al [Citation24].
![Figure 1. The hbl operon of B. cereus strain F837/76. The operon consists of the genes hblC, D, A and B, encoding the proteins Hbl L2, L1, B and B,’ respectively [Citation28,Citation32]. hblC and D are separated by 61, hblD and A by 36 bp. Between hblA and B is a space of 402 bp. Upstream and downstream of hblB, a stem loop has been detected [Citation9]. The promoter of the hblCDA operon is shown, including the transcription start TAA [Citation33]. 236 bp upstream of the promoter, a binding box of the global regulator protein PlcR has been identified [Citation34]. The figure was adapted from Dietrich et al [Citation24].](/cms/asset/e098959e-affd-4982-a0f8-5d8e7b6d46f4/kvir_a_2046951_f0001_b.gif)
Figure 2. Detection of hblB expression in 12 different B. cereus strains. Strains were grown for 3 h in CGY full medium before preparation of total RNA. (a). Control of RNA integrity on 1% agarose gel. (b). Control PCR of a 241 bp fragment of the 16S rRNA gene. Only primers were visible. Negative PCR results revealed no residual DNA in the samples. Chromosomal DNA from F837/76 served as positive control (+a), H2O as negative control (−a). (c). PCR amplification of a 166 bp fragment of hblB after reverse transcription of the RNA samples. The fragment represents the 3' part of the gene not identical with hblA . Chromosomal DNA from F837/76 (+a) as well as INRA A3 (+b) served as positive, H2O as negative control (−a). Chromosomal DNA samples of strains NVH 0075–95 (Nhe reference, no hbl genes, named -b) and hblB-negative strain MHI 226 (−c) did also not result in a PCR product. *: cDNA of strain F837/76 grown under simulated intestinal conditions in a previous experiment.
Figure 3. Binding of mAb 11A5 to rHbl B and B.’ (a). Purification of rHbl B’ via N-terminal strep-tag. In the amino acid sequence, the strep-tag is depicted in blue, the linker in orange letters. The predicted signal sequence for secretion [Citation34] is underlined and eliminated amino acids are highlighted in gray. The predicted molecular weight is 51.5 kDa. The protein was detected via Western blot using the strep-tag-specific StrepMAB-Classic. (b). Western blot with decreasing amounts of the rHbl B and B’ proteins. The two proteins are simply distinguishable according to their molecular weight (rHbl B: 40.9 kDa, rHbl B:’ 51.5 kDa). Blackness values are depicted in proportion to the utilized protein concentrations.
![Figure 3. Binding of mAb 11A5 to rHbl B and B.’ (a). Purification of rHbl B’ via N-terminal strep-tag. In the amino acid sequence, the strep-tag is depicted in blue, the linker in orange letters. The predicted signal sequence for secretion [Citation34] is underlined and eliminated amino acids are highlighted in gray. The predicted molecular weight is 51.5 kDa. The protein was detected via Western blot using the strep-tag-specific StrepMAB-Classic. (b). Western blot with decreasing amounts of the rHbl B and B’ proteins. The two proteins are simply distinguishable according to their molecular weight (rHbl B: 40.9 kDa, rHbl B:’ 51.5 kDa). Blackness values are depicted in proportion to the utilized protein concentrations.](/cms/asset/2b1a2642-5fd5-4f8d-9c07-c9a9da5c1da6/kvir_a_2046951_f0003_oc.jpg)
Figure 4. Detection of Hbl B and B’ in the supernatant of several B. cereus strains. Western blots were performed using specific mAb 11A5. After 20 s exposure, strong signals for Hbl B appeared. Thus, the membrane was cut and Hbl B’-specific signals were detected after an additional 3 min exposure. This procedure is possible due to the molecular weights of Hbl B (approx. 40 kDa) and Hbl B’ (approx. 50 kDa). The recombinant proteins, which were used as concentration standards, appeared slightly bigger in the gel than the native proteins, which is due to their additional strep-tag (refer to Figure 3). Shown is one representative blot per strain. Protein concentrations were calculated according to rHbl B and rHbl B’ concentration standards as mean of 2–4 individual blots. For strains F837/76 and F837/76 ∆nheABC, no Hbl B’ protein could be detected. NVH 0075–95 and MHI 226 were applied as negative controls. 0: no detectable signal. tr: traces.
Figure 5. Hbl B’ does not substitute for other Hbl components. rHbl components L2, L1, B and B’ were set to 1.5 pmol/µl each and mixed in 1:1:1 ratios. (a). For WST-1 bioassays on Vero cells the pre-mixed rHbl components were applied as dilution series. (b). For measurement of PI influx into Vero cells the pre-mixed rHbl components were used in 1:40 dilution. (c). PI influx test on CaCo-2 cells. Samples were applied as in B. (d). PI influx test on A549 cells. Samples were applied as in B. (e). Ten µl of each protein component were pipetted into a stamp hole in sheep blood agar plates.
Figure 6. Effects of rHbl B’ on the cytotoxic activity of Hbl. (a). Effects on Vero cells as measured by WST-1 bioassays. The rHbl components L2, L1 and B (1.5 pmol/µl each) were mixed in a 1:1:1 ratio. rHbl B’ was added in increasing ratios. The mixture was applied as dilution series to the cells. (b). PI influx test on Vero cells. rHbl L2, L1, B (1:1:1) and increasing ratios of rHbl B’ were pre-mixed and added in 1:40 dilution to the cells. Increasing ratios of BSA were carried along as control. All proteins had an initial concentration of 1.5 pmol/µl. (c). Experimental setup analogous to b. Instead of rHbl, supernatant of B. cereus strain F837/76 ∆nheABC was used. (d). Experimental setup analogous to b. Instead of Vero, CaCo-2 cells were used. The 1:1:1:1 protein mixture was tested. (e). Experimental setup analogous to b. Instead of Vero, A549 cells were used. The 1:1:1:1 protein mixture was tested.
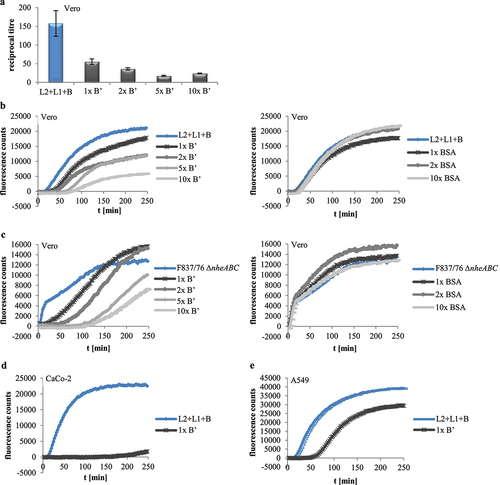
Figure 7. Effect of rHbl B’ on the hemolytic activity of Hbl. (a). rHbl components L2, L1 and B (1.5 pmol/µl each) were mixed in 1:1:1 ratio. 10 µl were applied into stamp holes on sheep blood agar plates together with 0.2x, 0.5x 1x, 5x and 10x rHbl B.’ For quantification, the same setup was used in hemolysis assays with defibrinated sheep blood. Results were compared to the positive control (erythrocytes in H2O), which was set to 100%. (b). rHbl B’ (1.5 pmol/µl) was pre-mixed with supernatant of B. cereus strains F837/76 or F837/76 ∆nheABC in volume ratios from 1:8 to 10:1. Ten µl of the mixtures were applied to the stamp holes. For quantification, samples were applied to hemolysis assays with defibrinated sheep blood. Results were compared to the positive control (erythrocytes in H2O), which was set to 100%. (c). Ten µl of rHbl B’ were applied to a stamp hole in approximately 2 mm distance to B. cereus F837/76 supernatant. The effect of rHbl B’ was compared to those of rHbl L2, L1 and B on supernatant of B. cereus strain F837/76 ∆nheABC.
Figure 8. Consecutive and combined application of rHbl B,’ B, L1 and L2 to Vero cells. Concentration of all proteins was 1.5 pmol/µl. (a). WST-1 bioassay. Vero cells were pre-incubated for 2 h with and without 1:40 dilution of rHbl B’ and washed three times in medium before application of a dilution series of rHbl L2+L1+B for 4 h. (b). PI influx test. rHbl components were individually and consecutively applied to the Vero cells in 1:40 dilution each. After each component, cells were washed three times in medium. (c). Flow cytometric analysis of rHbl B and rHbl B’ on Vero cells using mAb 11A5. Black: negative control without antigen. Light green: rHbl B. Grey: rHbl B.’ Mean and standard deviation (fluorescence-positive cells) of two runs, each in duplicates, are shown. (d). Flow cytometric analysis of rHbl on Vero cells using mAb 1B8. Black: negative control without antigen. Dark green: rHbl B. Light green: rHbl B+L1. Blue: rHbl B+L2. Grey: rHbl B+B.’ Means and standard deviations (fluorescence-positive cells) of triplicates are shown. (e). Flow cytometric analysis of rHbl on Vero cells using mAb 1G8. Black: negative control without antigen. Light green: rHbl B. Grey: rHbl B+B.’ Means and standard deviations (fluorescence-positive cells) of triplicates are shown. Additional flow cytometry data can be found in Figure S1. Here, one representative overlay histogram is depicted, respectively.
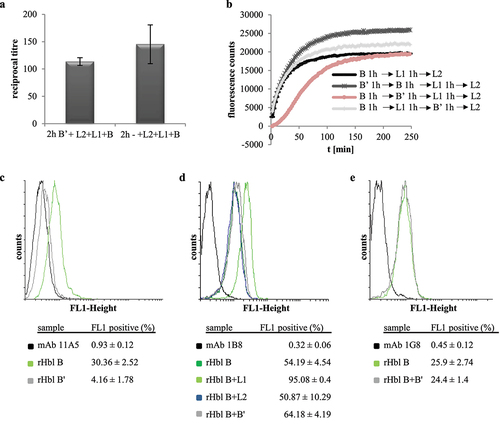
Figure 9. Results of SPR measurements. Binding was tested between rHbl B’ (coupled) and rHbl L1, L2 and B as ligands. Depicted are the representative sensorgrams for pairs B’/L1, B’/L2 and B’/B. or the pair B’/L1 calculated equilibrium dissociation rate (KD), error as standard deviation from three independent experiments as well as the chi2 value for the curve fit are shown. Concentration series color code: red: 7.8 nM, dark green: 15.6 nM, blue: 31.2 nM, magenta: 62.5 nM, cyan: 125 nM, orange: 250 nM, dark magenta: 500 nM, light green: 1 μM and red: 2 μM. RU: response units.
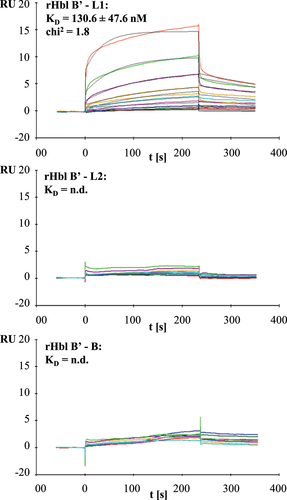
Figure 10. In silico comparison of Hbl B and Hbl B’ of B. cereus strain F837/76. A. DNA sequence alignment using clustal omega [46] of hblA and the 273 bp longer hblB gene. B. Amino acid sequence alignment using clustal omega [46] of the corresponding Hbl B and Hbl B’ proteins. C. Structural comparison. Protein models were gained using SWISS-MODEL [47]. The N-terminus is in the upper part of each image, the C-terminus is centred in the front of each image, and the C-terminal amino acid is highlighted. Hbl B: Sequence identity to Hbl B with solved crystal structure (PDB ID: 2nrj; [15]) = 99.42 %. Hbl B’: 2nrj was also used as template, sequence identity = 71.39 %. For the C-terminal part, which is not similar to Hbl B (refer to A and B), no template exists and thus, it could not be modeled.
![Figure 10. In silico comparison of Hbl B and Hbl B’ of B. cereus strain F837/76. A. DNA sequence alignment using clustal omega [46] of hblA and the 273 bp longer hblB gene. B. Amino acid sequence alignment using clustal omega [46] of the corresponding Hbl B and Hbl B’ proteins. C. Structural comparison. Protein models were gained using SWISS-MODEL [47]. The N-terminus is in the upper part of each image, the C-terminus is centred in the front of each image, and the C-terminal amino acid is highlighted. Hbl B: Sequence identity to Hbl B with solved crystal structure (PDB ID: 2nrj; [15]) = 99.42 %. Hbl B’: 2nrj was also used as template, sequence identity = 71.39 %. For the C-terminal part, which is not similar to Hbl B (refer to A and B), no template exists and thus, it could not be modeled.](/cms/asset/a38d15db-1415-4d61-94b5-15d7c703415b/kvir_a_2046951_f0010_oc.jpg)
Figure 11. Purification and activity of the truncated protein rHbl B’(tr). Concentration of all proteins was set to 1.5 pmol/μl in each activity test. (a). SDS PAGE and Sypro staining of rHbl B’ (50.6 kDa) and rHbl B’(tr) (41.2 kDa). (b). Replacement of rHbl L2, L1 or B by rHbl B’(tr) on blood agar plates and in WST-1 and PI influx tests on Vero cells. Fluorescence counts are generally lower than in comparable experiments (see Figure 5), as they were obtained in a later approach with less active PI. (c). Flow cytometric analysis of rHbl B’(tr) on Vero cells using mAb 11A5. Black: only Vero cells. Dark gray: negative control without antigen. Light green: rHbl B as control. Fluorescence intensities vary compared to a similar approach (see Figure 8c), as protein incubation times were extended. Blue: rHbl B’ as control. Cyan: rHbl B’(tr). One representative overlay histogram as well as means and standard deviations (fluorescence-positive cells) of triplicates are shown. Additional flow cytometry data can be found in Figure S1. (d). Addition ofrising amounts of rHbl B’(tr) to rHbl or supernatant of strain F837/76 on blood agar plates. Plates with the rHbl samples were photographed after 24 h incubation at 32°C.
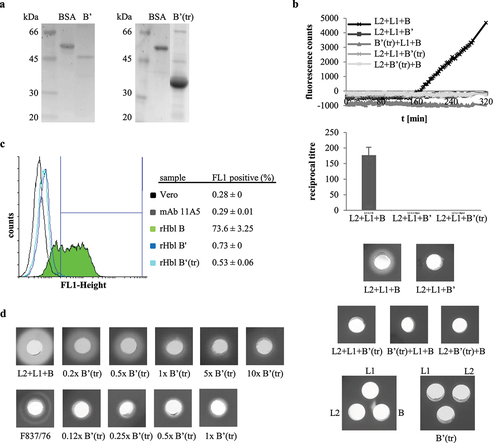
Figure 12. Properties of rHbl proteins from nine B. cereus strains. (a). Purified rHbl B’ proteins on SDS PAGE detected by Sypro Ruby, strep-tag specific StrepMAB-Classic and Hbl B/B’- specific mAb 11A5. (b). Inhibition of hemolytic activity by the rHbl B’ proteins. Ten µl of rHbl B’ were filled into the stamp holes on sheep blood agar plates and incubated for 1 h at 32°C before further 10 µl of a mixture of rHbl L2, L1 and B were applied. Plates were photographed after 24 h. Concentration of each recombinant protein: 1.5 pmol/µl. (c). Results of propidium iodide influx tests. Supernatant of strain F837/76 ∆nheABC was pre-mixed with rHbl B’ in an 1:1 volume ratio and subsequently applied to Vero cells in 1:40 dilution. (d). Results of propidium iodide influx tests. The rHbl components B, L1 and L2 were pre-mixed with rHbl B’ in a 1:5 ratio and subsequently applied to Vero cells in 1:40 dilution. Concentration of each recombinant protein: 1.5 pmol/µl.
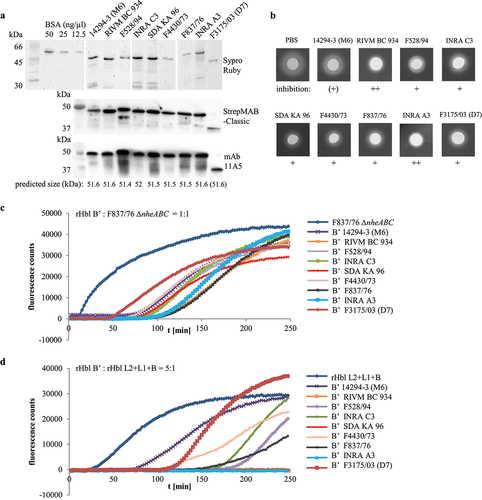
Table 1. Effects of rHbl B’ proteins from nine B. cereus strains on Hbl activity. Summary of hemolysis and pore formation experiments depicted in Figure 12. ++: strong inhibitory effect, +: inhibitory effect, (+): weak inhibitory effect.
Supplemental Material
Download Zip (2.1 MB)Data availability statement
Data sharing is not applicable to this article as no additional data were created or analyzed in this study.