
Figures & data
Figure 1. S. mutans inhibits filamentous growth of C. albicans at 30°C . (a) C. albicans SC5314 cells (1 × 10⁶) were mixed with S. mutans cells (1 × 10⁷) and co-cultured in BHI-sucrose medium or BHI + Lee’s glucose medium at 30°C for 24 hours. (b) the supernatant of S. mutans was mixed with C. albicans SC5314 cells (1 × 10⁶) and incubated in BHI-sucrose medium or BHI + Lee’s glucose medium at 30°C for 24 hours. the “-” sign indicates that no filamentous cells were observed; “±”, “+”, “++”, and “+++”, represent 1–10%, 10–30%, 30–50%, and 50–70% of filamentous cells, respectively. Scale bar, 20 µm.
Figure 2. Identification of a tetramic acid compound, mutanocyclin, produced by S. mutans, as an inhibitor of C. albicans filamentous growth. (a) HPLC analysis of the supernatant extracts of the S. mutans, S. mutans mixed with C. albicans, S. mutans Δmuc mutant, and S. mutans Δmuc mixed with C. albicans cultures. The BHI-sucrose medium served as a negative control. The X-axis represents the retention time in minutes, and the Y-axis is the absorbance unit (mAU) at 235 nm. Chemically synthesized mutanocyclin served as the reference standard (STD). the black arrow indicates the peak of mutanocyclin. (b) Chemical structure of mutanocyclin. MW: molecular weight. (c) Morphologies of C. albicans (SC5314) in the presence of supernatant from S. mutans, S. mutans Δmuc mutant, or E. coli cultures. C. albicans cells (1 × 10⁶) were incubated in BHI + Lee’s glucose medium with or without an equal volume of the bacterial supernatant extracts at 30°C for 48 hours. the number of “+” signs indicates the degree of filamentation. the “-” sign indicates that no filamentous cells were observed; “+” and “++” represent 10–30% and 30–50% of filamentous cells, respectively. Scale bar, 20 µm.
Figure 3. Inhibitory effect of mutanocyclin onC. albicans filamentation. (a) Morphologies of C. albicans cells in the presence of DMSO or 8, 16, and 32 µg/ml of mutanocyclin. C. albicans cells (SC5314, 1 × 10⁴) were incubated in BHI-sucrose medium with or without mutanocyclin at 30°C for 24 to 36 hours. the number of “+” signs indicates the degree of filamentation. the “-” sign indicates that no filamentous cells were observed; “±”, “+”, “++”, and “+++”, represent 1–10%, 10–30%, 30–50%, and 50–70% of filamentous cells, respectively. Scale bar, 20 µm. (b) Relative expression levels of C. albicans filamentous-related genes in DMSO- or mutanocyclin-treated (32 µg/ml) cells. the expression level in the DMSO control was set to 1. Error bars denote the standard deviation (SD). *P < .05 (Student's t test, two tailed). (c) Growth curves of C. albicans cells treated with DMSO (control) containing 8 µg/ml, 16 µg/ml, and 32 µg/ml of mutanocyclin. the X-axis and Y-axis represent the culture time and corresponding cell density (OD600). Bars indicate standard deviations.
Figure 4. Effect of mutanocyclin on the global gene expression profile of C.albicans. (a) Venn diagram depicting differentially expressed genes. A twofold difference cutoff and false discovery rate (FDRs) <.05 were used to define differentially expressed genes. (b) GO enrichment analysis of differentially expressed genes. Red or blue dots represent upregulated or downregulated genes in response to mutanocyclin treatment, respectively. The inner cycle bars represent the statistical significance. (c) Selected differentially expressed genes indicated by the R package heat map. Log2(M/D), Log2 (read counts of mutanocyclin treatment/read counts of DMSO control).
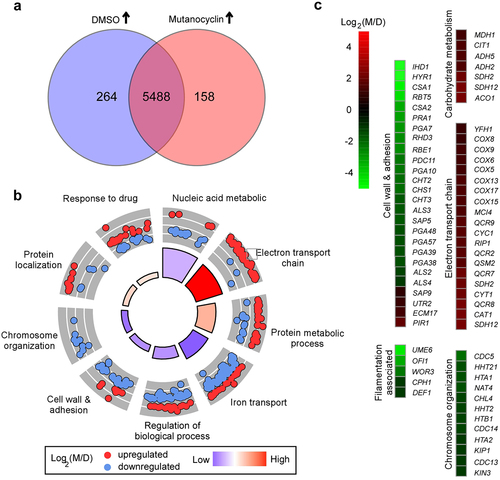
Figure 5. Three cell wall-related genes are identified as negative regulators in the presence of mutanocyclin. (a) Cellular morphologies of the hyr4/hyr4, spr1/spr1, and iff8/iff8 mutants in the presence of DMSO or mutanocyclin. C. albicans cells (1 × 10⁴) were grown in Lee’s glucose medium containing DMSO or 32 µg/mL mutanocyclin, and incubated at 30°C for 24 hours. “±”, “++”, and “+++” represent 1–10%, 30–50%, and 50–70% of filamentous cells, respectively. Scale bar, 20 µm. (b) Relative expression levels of HYR4, SPR1, and IFF8 in efg1/efg1mutants treated with DMSO or mutanocyclin (32 µg/mL). The expression level of the WT strain treated with DMSO was set as 1. Error bars denote the standard deviation (SD). *P < .05 (Student's t test, two tailed).
Figure 6. Role of the Ras1-cAMP/PKA signaling pathway in mutanocyclin-regulated filamentation in C.albicans. (a) Confocal laser scanning microscopic images of C. albicans (SC5314) cells treated with mutanocyclin (blue) for 0.5 or 24 hours. Scale bar, 10 µm. (b) Cellular morphologies of the Ras1-cAMP/PKA signaling mutants and TPK2-overexpressing strain in the presence of DMSO or mutanocyclin. Fungal cells were grown in liquid Lee’s glucose medium containing mutanocyclin (32 µg/mL) or DMSO, and incubated at 30°C for 24 hours. The “-” sign indicates that no filamentous cells were observed; “+”, “+++”, and “++++”, represent 10-30%, 50-70%, and >70% of filamentous cells, respectively. Scale bar, 20 µm. (c) Relative expression levels of TPK1, TPK2, and four transcription factor-encoding genes in C. albicans cells treated with DMSO or mutanocyclin (32 µg/mL). The expression level in DMSO was set as 1. Error bars denote the standard deviation (SD). *P < .05 (Student's t test, two tailed).
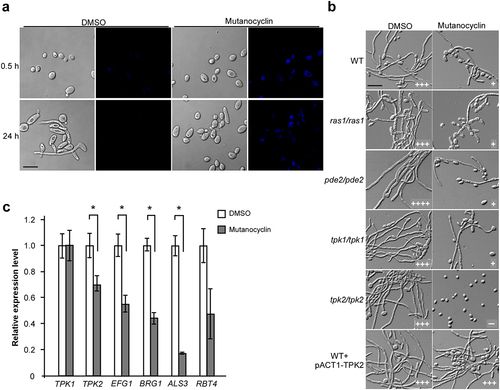
Figure 7. A library screen identifies a set of transcriptional regulators involved in the response to mutanocyclin treatment. (a) Cellular morphologies of the sfl1/sfl1, ahr1/ahr1, nrg1/nrg1, ssn6/ssn6, fcr1/fcr1 mutants in the presence of DMSO or mutanocyclin. C. albicans cells (1 × 10⁴) were grown inLee’s glucose medium containing DMSO or 32 µg/mL mutanocyclin, and incubated at 30°C for 24 hours. “±”, “++”, “+++”, and “++++” represent 1–10%, 30–50%, 50–70%, and >70% of filamentous cells, respectively. Scale bar, 20 µm. (b) Model of Sfl1-mediated regulation of filamentation in C. albicans. (c) Relative expression levels of FCR1 in the WT (SC5314), tpk2/tpk2, and sfl1/sfl1 strains treated with DMSO or mutanocyclin (32 µg/mL). The expression level of the WT strain treated with DMSO was set as 1. Error bars denote the standard deviation (SD). *P < .05 (Student's t test, two tailed).
Figure 8. Effects of mutanocyclin on the virulence of C.albicans in mouse and G. mellonella infection models. (a) Histopathological assays. C. albicans SC5314 cells (1 × 10⁷) in 5 μL of PBS containing DMSO or mutanocyclin (32 μg/mL) were spotted on the removed tongues of 4 − 5-week-old mice. After 24 hours of infection at 37°C, the infected tongues were stained with PAS and then used for microscopy assays. Scale bar, 20 µm. (b) Scanning electron microscope (SEM) images of the infected tongue tissues. Scale bar, 10 µm. (c) Survival rates of C. albicans-infected G. mellonella larvae treated with DMSO or mutanocyclin. C. albicans SC5314 cells (1 × 10⁸ CFU/mL) and DMSO, or 6.4, 12.8, or 25.6 µg mutanocyclin, were injected individually into each G. mellonella larva (20 larvae in each treatment group). *P < .05 (compared with the DMSO control, Student's t test, two tailed).
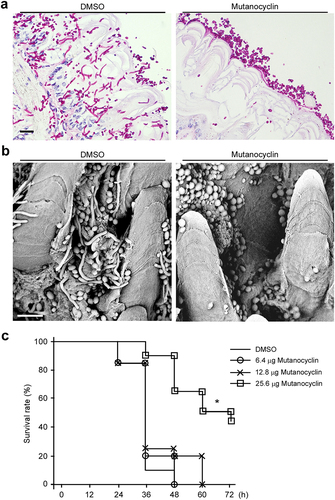
Figure 9. Model for the mutanocyclin-mediated interspecies interaction between C. albicans and S. mutans. S. mutans secretes the secondary metabolite, mutanocyclin, which regulates filamentation of C. albicans through the Ras1-cAMP/PKA signaling pathway and a set of transcription factors and cell wall-associated proteins.
Data availability statement
All primary data that support the findings of this study are available from the corresponding author upon reasonable request.