
Figures & data
Table 1. Composition of trivalent LAIV 2017–2018
Figure 1. The scheme of experimental setup for mouse study.
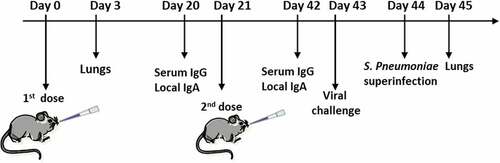
Figure 2. Viral load in the lungs on day 3 after immunization estimated in ELISA test (n = 5). * - P < .05. A. Viral titers were determined using quantitative rRT-PCR. Standard curves were built for each vaccine virus based on viral RNA isolated from allantois virus-containing fluid with virus titers of 7 log10 EID50/ml. B. the results of lung homogenates titration in CE starting from a dilution of 1:10. А value of 1.5 indicates the sensitivity threshold of the method.
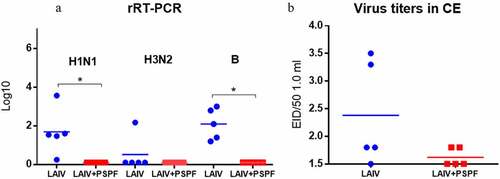
Figure 3. Early cytokine production in the lung homogenates estimated in ELISA (n = 5). * - P < .05, ** - P < .01. CBA mice were intranasally inoculated using trivalent seasonal LAIV and S. pneumoniae recombinant peptide PSPF. the lungs were collected on day 3 after immunization.
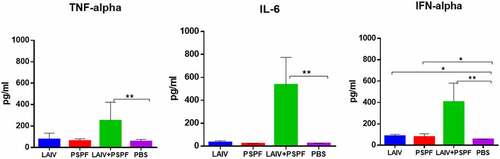
Figure 4. Early cytokine production in THP-1 cell culture, ELISA. * - P < .05, ** - P < .01. Cells were inoculated with 106 EID50/ml of A/17/New York (H1n1)pdm09 LAIV virus, the PSPF polypeptide (20 µg per ml) or the mixed LAIV+PSPF. Data from three independent experiments made in duplicates are presented.
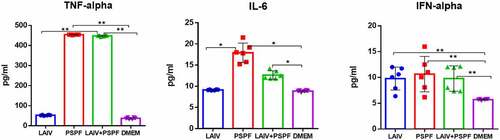
Figure 5. Immune response to A/H1N1, A/H3N2 and B/Victoria influenza viruses estimated using ELISA assay three weeks after 1st vaccination and revaccination (n = 6). A, B, C – serum IgG. D, E, F – local IgA. * - P < .05, ** - P < .01.
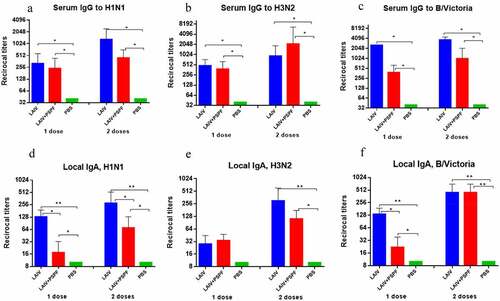
Figure 6. ELISA antibodies to PSPF three weeks after 1st vaccination and revaccination (n = 6).* - P < .05, ** - P < .01. A. Serum IgG. B. Local IgA. * - P < .05, ** - P < .01.
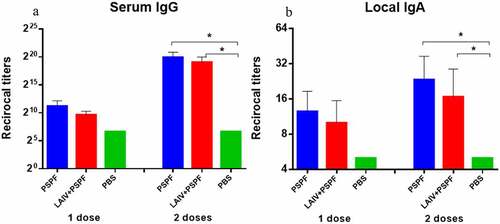
Figure 7. Post-Influenza pneumococcal infection of the non-immunized mice. A. Survival proportions (n = 10 per group). to infect mice, we used: 1) pandemic strain A/South Africa/3626/2013 (H1N1) pdm09 at 1 LD50 (blue line); 2) 5 × 10⁴ CFU of S. pneumoniae (red line); 3) H1N1 influenza virus followed by S. pneumoniae infection 24 hours apart (green line). * - P < .05 compared to bacterial post-influenza infection. B. S. pneumonia content in the lungs 5 and 24 hours after bacterial infection performed without influenza infection (blue dots) and against the background of influenza infection (red dots) (n = 5). * - p < .05.
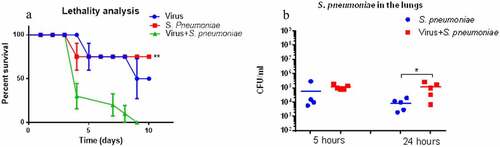
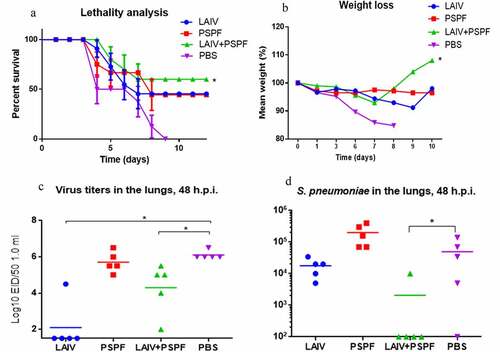
Figure 8. Protection against A/South Africa/3626/2013(H1N1) pdm09 influenza challenge followed by S. pneumoniae infection 24 hours apart. A, B. Data from one of two independent experiments are provided. the survival rate and weight loss (n = 10 in group). C. Infectious virus isolation from the lungs 48 hours after primary virus challenge (n = 5). D. S. Pneumoniae load in the lungs on 24 hours after bacterial superinfection; titers of 102 present method sensitivity threshold (n = 5).* - p < .05.
Data availability statement
The data supporting the findings obtained in this study are available in “Figshare” at http://doi.org/[10.6084/m9.figshare.16974706].