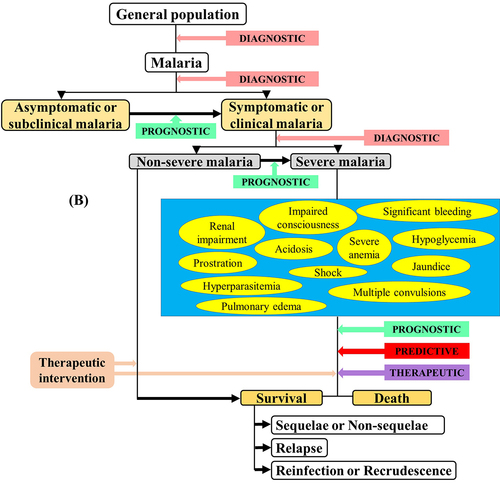
*These signs/symptoms are variably defined with respect to the Plasmodium species.
Definitions of Po and Pm severe malaria are not stated in the guidelines.
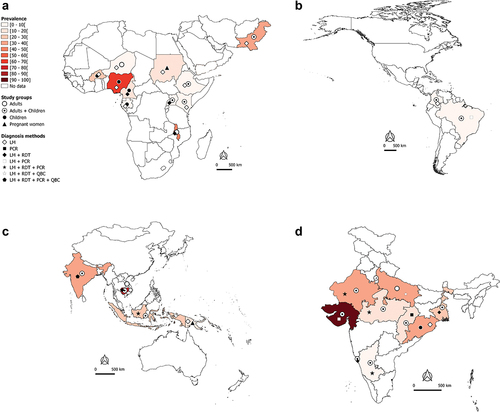
Figure 2A. Worldwide burden of severe malaria.
(1-4) In-hospital-attended patients due to Plasmodium spp species.
(1-4) P. falciparum mono-infections.
(1-4) P. vivax mono-infections in African and Eastern Mediterranean regions (A1, B1, C1), The Americas region (A2, B2, C2), South East Asia and West Pacific regions (A3, B3, C3), and India (A4, B4, C4), 2010—2020.
In (1-4), the total number of SM cases irrespective of the malaria species identified in studies was used to determine the proportion of SM in a country or an area.
Weighted proportions were calculated to depict hospital-admitted SM. For a same country or area, the weight of a study was determined by dividing the sample size of admitted patients in this study by the total number of admitted patients of all studies conducted in the country or area. The overall estimate of the SM proportion was then computed by summing up the product of SM prevalence in each study and the weight of the study.
The data are sourced from research articles retrieved from PubMed (https://pubmed.ncbi.nlm.nih.gov/), published in English and French languages We excluded studies with a small sample size, case—control design, published before 2010, imported malaria, studies with no country-wise data, and reviews/abstracts/book chapters.
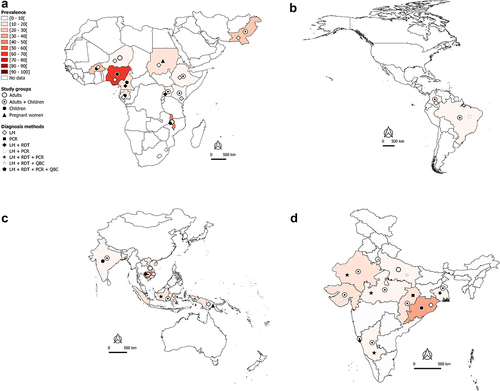
Figure 2B.
Continued.
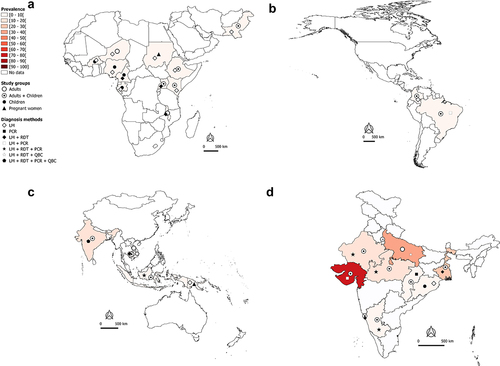
Figure 2C. Continued.
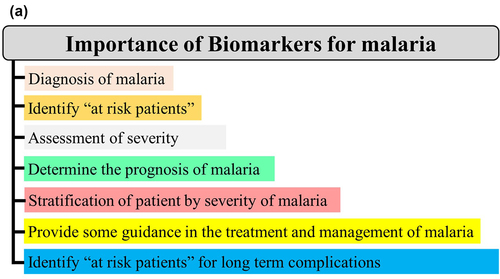
Figure 3A.
Continued.
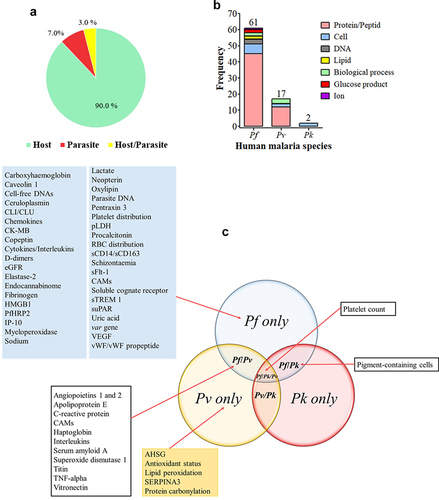
Figure 3B. Importance (A) and categorization (B) of biomarkers in malaria infection.
Figure 4. Clinical biomarkers and severe malaria.
Origin of biomarkers.
Biological nature of biomarkers by malaria species.
Type of biomarkers evaluated.
Biomarkers for which reporting AUC/sensitivity/specificity values were included.
In 4B, the numbers above the histograms represent the total number of evaluated biomarkers for each malaria species.
In 4C, some biomarkers were studied in more than one malaria species (e.g. the platelet count was evaluated as biomarkers of severe malaria with Pf, Pv, or Pk).
AHSG: alpha-2-Heremans-Schmid glycoprotein, AUC: area under the curve, CAMs: cell adhesion molecules, CK-MB: cardiac disease creatine kinase muscle-brain type, CLI/CLU: circulatory complement‑lysis inhibitor or clusterin, DNA: deoxyribonucleic acid, eGRF: estimated glomerular filtration rate, HMGB1: high-mobility group box protein 1, HRP2: histidine-rich protein 2, IP-10: 10-kDa INF gamma-induced protein, Pf: Plasmodium falciparum, Pk: Plasmodium knowlesi, Pv: Plasmodium vivax, pLDH: parasite lactate dehydrogenase, RBC: red blood cell, sICAM-1: soluble intercellular cell adhesion molecule 1, SERPINA3: serpin peptidase inhibitor clade A member 3, sTie-2: soluble cognate receptor, sTREM 1: soluble triggering receptor expressed on myeloid cells 1, suPAR: soluble urokinase-type plasminogen activator, TNF: tumour necrosis factor, VEGF: vascular endothelial growth factor, vWF: von Willebrand factor.
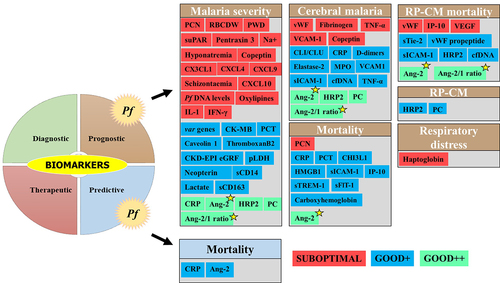
Figure 5. Biomarkers evaluated for severe Pf-SM.
Biomarkers for AUC/sensitivity/specificity values were included.
Biomarkers for severe Pf malaria were categorized into three groups: i) suboptimal [the biomarker has AUC and/or sensitivity and specificity values below thresholds], ii) Good+ [the biomarker has AUC and/or sensitivity and specificity values above thresholds, but with limited evidence of its clinical utility due to several reasons, including a low number of studies (n = 1), no statistical significance was provided for AUC, evaluated in a specific population (i.e. nonimmune European travelers and evaluated by the same research team], and iii) Good++ [the biomarker has AUC and/or sensitivity and specificity values above thresholds, and strong evidence of its clinical utility due to several reasons including number of studies > 1, statistical significance provided for AUC, evaluated in different malaria endemic settings, evaluated in populations from malaria endemic areas, and evaluated by different research teams]. The Ang-2 and Ang-2/1 ratio (yellow star) showed good prognosis performances for most of the SM-related outcomes.
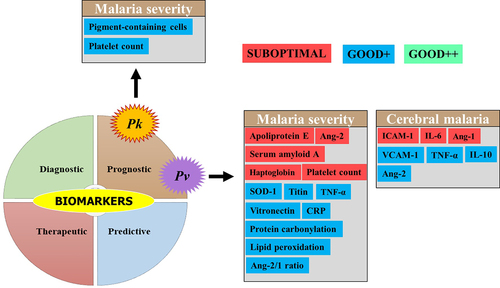
Figure 6. Biomarkers evaluated for severe Pv and Pk malaria.
Biomarkers for AUC/sensitivity/specificity values were included.
Biomarkers for severe Pv and Pk malaria were categorized into three groups: i) suboptimal [the biomarker has AUC and/or sensitivity and specificity values below thresholds], ii) Good+ [the biomarker has AUC and/or sensitivity and specificity values above thresholds, but with limited evidence of its clinical utility due to several reasons including a low number of studies (n = 1), no statistical significance was provided for AUC, evaluated in a specific population (i.e. nonimmune European travelers, and evaluated by the same research team], iii) Good++ [the biomarker has AUC and/or sensitivity and specificity values above thresholds, and strong evidence of its clinical utility due to several reasons including number of studies > 1, statistical significance provided for AUC, evaluated in different malaria endemic settings, evaluated in populations from malaria endemic areas, and evaluated by different research teams].
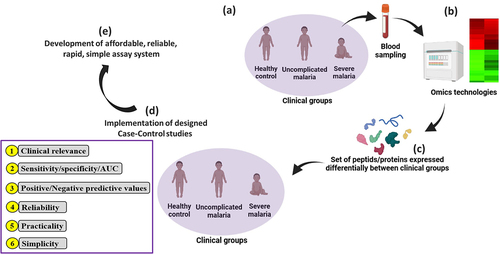
Figure 7. Utility of omics technologies to accelerate the identification and validation of clinical biomarkers for SM.
(a) Blood samples are collected from a small number of individuals based on symptomatology of malaria (i.e. no malaria/healthy control, uncomplicated malaria, and severe malaria). These different clinical groups are defined based on the objectives of the study. (b) Samples are processed using omics technologies to identify RNA/protein/peptide expression patterns between these different clinical groups in order to identify differentially expressed molecules. (c) The most differentially expressed biomolecules are identified and characterized (d) Case–control studies may be implemented to evaluate the clinical value of these sets of selected biomolecules. Parameters such as sensitivity, specificity, and area under the curve can be evaluated. Other aspects such as reliability, simplicity, and practicality of the measurement method can be evaluated in parallel. In this scenario, three clinical groups were used as an example, but design could be made more complex by defining or adding supplementary clinical groups (e.g. i—severe Pf + Pv cases, ii—different severe malaria forms as cerebral malaria, severe malarial anemia, respiratory distress, iii—severe co-infections with Plasmodium and other pathogens – virus, bacteria, etc.) and then performing omics technologies as presented in the figure, and (e) the development of a rapid, reliable, and affordable assay system should be the final step for the utilization of clinical biomarkers.
Table 2. Some proposed severe malaria biomarkers for which clinical performances were not evaluated.
Barber BE, Grigg MJ, Piera KA, et al. Intravascular haemolysis in severe Plasmodium knowlesi malaria: association with endothelial activation, microvascular dysfunction, and acute kidney injury. Emerg Microbes Infect. 2018;7(1):106. DOI:http://dx.doi.org/10.1038/s41426-018-0105-2.
Casals-Pascual C, Idro R, Gicheru N, et al. High levels of erythropoietin are associated with protection against neurological sequelae in African children with cerebral malaria. Proc Natl Acad Sci, USA. 2008;105(7):2634–2639. DOI:10.1073/pnas.0709715105.
Kaminski L-C, Riehn M, Abel A, et al. Cytotoxic T cell-derived granzyme B is increased in severe Plasmodium falciparum malaria. Front Immunol. 2019;10:2917.
Pankoui Mfonkeu JB, Gouado I, Fotso Kuaté H, et al. Elevated cell-specific microparticles are a biological marker for cerebral dysfunctions in human severe malaria. PLoS One. 2010;5(10):e13415. DOI:10.1371/journal.pone.0013415.
Ray S, Kumar V, Bhave A, et al. Proteomic analysis of Plasmodium falciparum induced alterations in humans from different endemic regions of India to decipher malaria pathogenesis and identify surrogate markers of severity. J Proteomics. 2015;127:103–113.
Elphinstone RE, Conroy AL, Hawkes M, et al. Alterations in systemic extracellular heme and hemopexin are associated with adverse clinical outcomes in Ugandan children with severe malaria. J Infect Dis. 2016;214(8):1268–1275. DOI:10.1093/infdis/jiw357.
Ray S, Patel SK, Venkatesh A, et al. Clinicopathological analysis and multipronged quantitative proteomics reveal oxidative stress and cytoskeletal proteins as possible markers for severe vivax malaria. Sci Rep. 2016;6(1):24557. DOI:http://dx.doi.org/10.1038/srep24557.
Vlad C, Burlacu A, Florea L, et al. A comprehensive review on apolipoproteins as nontraditional cardiovascular risk factors in end-stage renal disease: current evidence and perspectives. Int Urol Nephrol. 2019;51(7):1173–1189. https://doi.org/10.1007/s11255-019-02170-w.
Dietmann A, Helbok R, Lackner P, et al. Endoglin in African children with Plasmodium falciparum malaria: a novel player in severe malaria pathogenesis? J Infect Dis. 2009;200(12):1842–1848. DOI:10.1086/648476.
Nduati E, Gwela A, Karanja H, et al. The plasma concentration of the B cell activating factor is increased in children with acute malaria. J Infect Dis. 2011;204(6):962–970. DOI:10.1093/infdis/jir438.
Urban BC, Cordery D, Shafi MJ, et al. The frequency of BDCA3-positive dendritic cells is increased in the peripheral circulation of Kenyan children with severe malaria. Infect Immun. 2006;74(12):6700–6706. DOI:10.1128/IAI.00861-06.
Harawa V, Njie M, Keller T, et al. Malawian children with uncomplicated and cerebral malaria have decreased activated Vγ9Vδ2 γδ T cells which increase in convalescence. PLoS One. 2019;14(10):e0223410. DOI:10.1371/journal.pone.0223410.
Barber BE, William T, Grigg MJ, et al. Asymmetric dimethylarginine in adult falciparum malaria: relationships with disease severity, antimalarial treatment, hemolysis, and inflammation. Open Forum Infect Dis. 2016;3(1):ofw027. DOI:10.1093/ofid/ofw027.
Barber BE, Grigg MJ, Piera KA, et al. Endothelial glycocalyx degradation and disease severity in Plasmodium vivax and Plasmodium knowlesi malaria. Sci Rep. 2021;11(1):9741. https://doi.org/10.1038/s41598-021-88962-6.
Melo GC, Monteiro WM, Siqueira AM, et al. Expression levels of pvcrt-o and pvmdr-1 are associated with chloroquine resistance and severe Plasmodium vivax malaria in patients of the Brazilian Amazon. PLoS One. 2014;9:e105922.
Buyon LE, Elsworth B, Duraisingh MT. The molecular basis of antimalarial drug resistance in Plasmodium vivax. Int J Parasitol Drugs Drug Resist. 2021;16:23–37.

![Figure 1. Latest WHO guidelines on the clinical presentation of severe malaria [Citation18].](/cms/asset/b5cc3603-4219-409a-bb12-19bd3a12df36/kvir_a_2056966_f0001_oc.jpg)