
Figures & data
Table 1. Sequences and conditions of the primers used in PCR analysis
Figure 1. (a) Plasmid maps of the surface-displayed expressing Lc-pPG1-Aha1 (left), and secretion expressing plasmid Lc-pPG2-Aha1 (right). (b) Western blot analysis. Cellular extracts (Cell) of Lc-pPG1-Aha1 and Lc-pPG2-Aha1 were analyzed with western blotting. MW indicates the molecular mass markers (kDa). 1: Aha1 protein, 2: Ctrl. Blue arrows indicate Aha1 (49 kDa) secreted by Lc-pPG1-Aha1 in cell lysate (left) and Lc-pPG2-Aha1 in supernatant (right), respectively. (c) Aha1 antigen was detected on the surface of Lc-pPG1-Aha1 (left) by flow cytometry, but not on the surface of Lc-pPG (right). (d) Immunofluorescence microscopy analysis. Lc-pPG1-Aha1 (left) and Lc-pPG (right), magnification: ×1,000. There was green fluorescence on the surface of Lc-pPG1-Aha1 and no immunofluorescence reaction on the Lc-pPG cell surface.
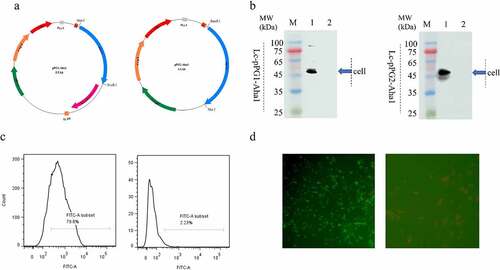
Figure 2. The colonies were directly PCR with pPG1 specific, pPG2 specific (above each group) or L. casei DnaA specific (below each group) primer pairs, and further analyzed by DNA sequencing, which was consistent with the speculated sequence. M: DNA ladder (bp), Lane 1-5: PCR products of recombinant L. casei with specific primers, gray (1250 bp), black (2392 bp), blue (2178 bp) and red arrow (615 bp).
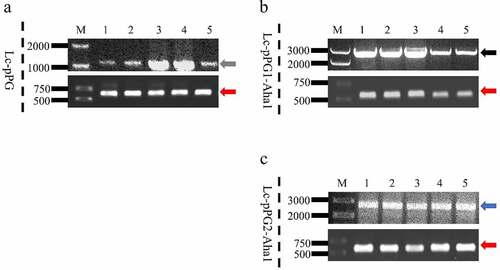
Table 2. The distribution of recombinant L. casei in the intestine
Figure 3. Relative content of the Aha1-specific IgM in serum (n = 5 fish/group) following treatment by Lc-pPG1-Aha1, Lc-pPG2-Aha1, Lc-pPG and PBS. Data are presented as mean SD fold increase relative to PBS control. *: p <0.05, **: p <0.01, ***: p <0.001.
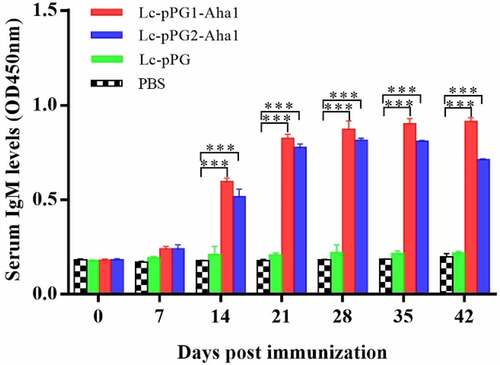
Figure 4. Humoral immune responses elicited by recombinant L. casei. Activities of acid phosphatase (ACP) (a) alkaline phosphatase (AKP) (b), lysozyme (LZM) (c), superoxide dismutase (SOD) (d), complement C3 (C3) (e) and complement C4 (C4) (f) in peripheral blood of common carp (n = 5 fish/group) after oral immunization. Data are presented as mean ± SD fold increase relative to PBS control. *: p <0.05, **: p <0.01, ***: p <0.001.
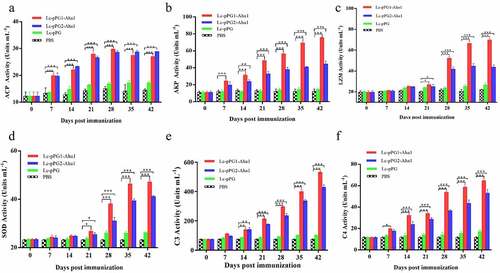
Figure 5. Leukocyte phagocytosis percentage and leukocyte phagocytic index in the serum (n = 5 fish/group) of fish vaccinated by Lc-pPG1-Aha1, Lc-pPG2-Aha1, Lc-pPG and PBS. Data are presented as mean ± SD fold increase relative to PBS control. *: p <0.05, **: p <0.01, ***: p <0.001.
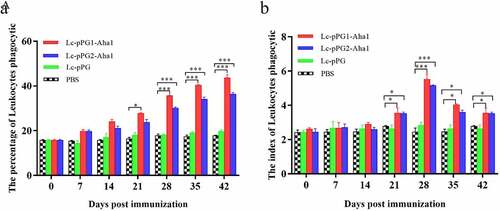
Figure 6. qRT-PCR analysis of the expression of IL-10 in Liver (A), Spleen(B),Kidney (C) and Intestine (D) of common carp (n = 5 fish/group) after immunization. Data are presented as mean ± SD fold increase relative to PBScontrol. *: p <0.05, **:p <0.01, ***: p <0.001.
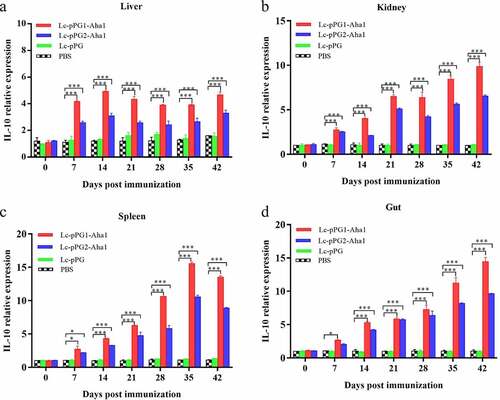
Figure 7. qRT-PCR analysis of the expression of IL-1β in Liver (a), Spleen(b), Kidney (c) and Intestine (d) of common carp (n = 5 fish/group) after immunization. Data are presented as mean ± SD fold increase relative to PBS control. *: p < 0.05, **: p < 0.01, ***: p < 0.001.
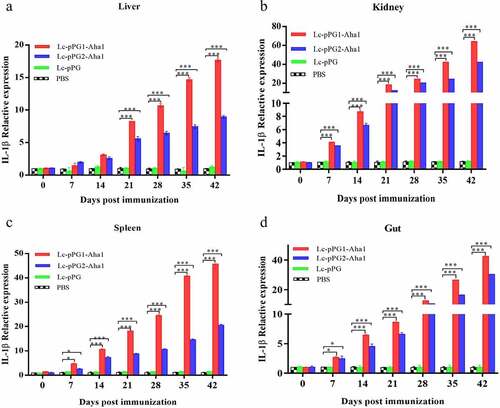
Figure 8. qRT-PCR analysis of the expression of TNF-α in Liver (a), Spleen(b), Kidney (c) and Intestine d) of common carp (n = 5 fish/group) after immunization. Data are presented as mean ± SD fold increase relative to PBS control. *: p < 0.05, **: p < 0.01, ***: p < 0.001.
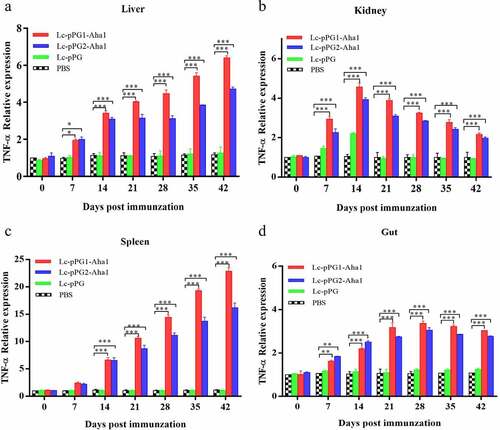
Figure 9. qRT-PCR analysis of the expression of TNF-α in Liver (a), Spleen(b), Kidney (c) and Intestine (D) of common carp (n = 5 fish/group) after immunization. Data are presented as mean ± SD fold increase relative to PBS control. *: p < 0.05, **: p < 0.01, ***: p < 0.001.
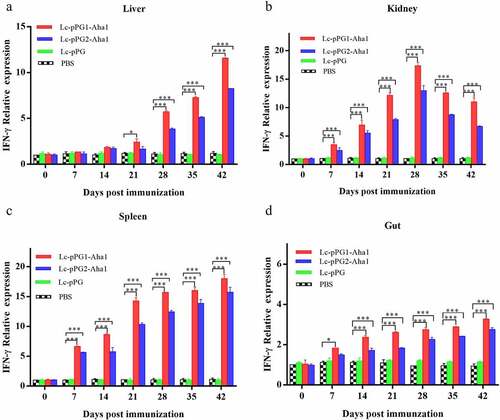
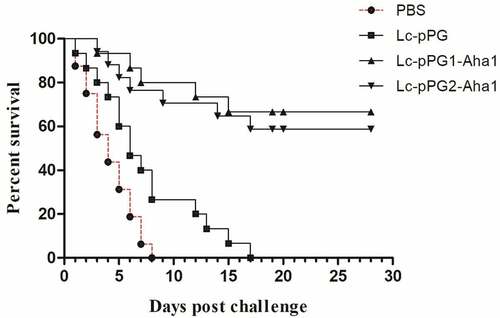
Figure 10. Survival rate of fish immunized with Lc-pPG1-Aha1, Lc-pPG2-Aha1, Lc-pPG, or PBS following challenge with the A.Hydrophila BSK-10 strain on post-immunization. 30 fish/group were used to record percent survival for 28 days.
Data availability statement
The authors declare that all data supporting the findings of this study are available in the manuscript or are available from the corresponding author upon request.