
Figures & data
Figure 1. PHB2 interacts with Vip3Aa. (a) proVip3Aa-Flag was mixed with GST-PHB2 or GST and glutathione sepharose 4B beads successively. After washing 5 times the beads were used for immunoblotting and anti-Flag antibody was used to detect the proVip3Aa-Flag on beads. (b) GST-PHB2 and GST were dotted on a PVDF membrane and the membrane was incubated with Vip3Aa-Flag. In the competitive experiment, the membrane already dotted with GST-PHB2 or GST was incubated with proVip3Aa-Flag plus 300-fold proVip3Aa without Flag tag. Then the proVip3Aa-Flag bound on PVDF membrane was detected with anti-Flag antibody. (c) PHB2-Flag was incubated with GST-proVip3Aa or GST and glutathione sepharose 4B beads successively, then the beads were washed 5 times followed by immunoblotting. The PHB2-Flag bound to the beads was detected with anti-Flag antibody. For dot blotting, GST-proVip3Aa and GST were dotted on a PVDF membrane directly and the membrane were incubated with PHB2-Flag. The PHB2-Flag bound to the PVDF membrane was detected with anti-Flag antibody. (d) MST assay to measure the binding affinity between Vip3Aa and PHB2. the labeled proVip3Aa and actVip3Aa were kept constant at 333 nM and 216 nM respectively, and the GST-PHB2 was titrated from 0.2 nM to 7 μM. the solid line and circular sign mean proVip3Aa fit and dose response respectively and the dotted line and triangle sign mean actVip3Aa fit and dose response respectively. (e) Sf-PHB2 cell lysate was incubated with proVip3Aa-Flag, actVip3Aa-Flag, or ChiB-Flag, and then 5 μL of rabbit anti-V5 antibody and 40 μL of protein G agarose beads were added successively. The beads were washed 5 times and the Flag tagged protein bound to the beads was detected with anti-Flag antibody. (f) PHB2 (red) was stained with anti-PHB2 polyclonal antibodies to show its localization in Sf9 cells. DAPI (blue) and FITC-phalloidin (green) were used to stain the nuclei and cell membrane respectively. Scale bar, 20 μm. (g) The localization of proVip3aa-RFP (red) and PHB2 (green) in Sf9 cells was observed by a confocal microscopy. PHB2 was stained with anti-PHB2 polyclonal antibodies. In control group, anti-GST polyclonal antibodies were used. the co-localization between PHB2 and Vip3Aa was point at by arrows. Nuclei were stained using DAPI (blue). Scale bar, 20 μm.
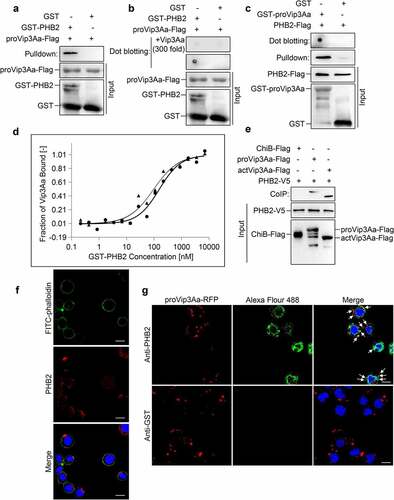
Figure 2. PHB2 interacts with receptor SR-C. (a) GST-PHB2 was incubated with Sf9 cell lysate and glutathione sepharose 4B beads successively. The beads were washed 5 times and detected by SDS-PAGE. Lane 1, the immune complexes. Lane 2, the remainder after GST and GST-PHB2 were excised. (b) The Sf9 cell lysate was incubated with GST-PHB2 or GST and glutathione sepharose 4B beads successively, then the beads were washed 5 times followed by an immunoblotting. The SR-C protein bound to the beads was detected with anti-SR-C antibody. (c) The Sf9 cell lysate was incubated with PHB2-Flag or ChiB-Flag, and then 5 μL of mouse anti-Flag antibody and 40 μL of protein G agarose beads was added successively. The beads were washed 5 times followed by an immunoblotting and the SR-C protein bound to the beads was detected with anti-SR-C antibody. (d) The Sf-PHB2 cell lysate was incubated with 5 μL of rabbit anti-V5 antibody and 40 μL of protein G agarose beads to immunoprecipitate SR-C. The beads were washed 5 times followed by an immunoblotting and the SR-C protein bound to the beads was detected with anti-SR-C antibody. (e) GST-PHB2, GST-PHB2ΔN, GST-PHB2ΔC, GST-PHB2D, and GST were incubated with Sf9 cell lysate and glutathione sepharose 4B beads successively respectively. The beads were washed 5 times followed by an immunoblotting and the SR-C protein bound to the beads was detected with anti-SR-C antibody.
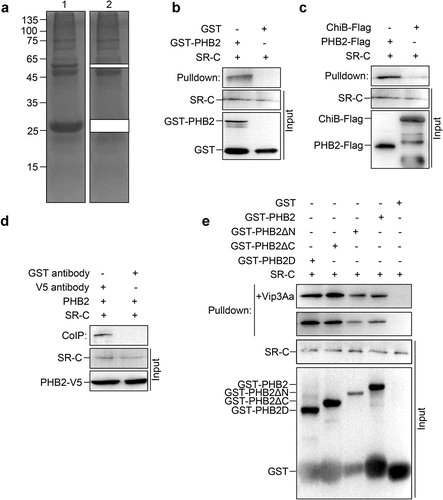
Figure 3. PHB2 affects Vip3Aa internalization. (a) PHB2, PHB1, and actin protein levels of Sf9, Sf-pIZT, Sf-Pi1, Sf-Pi2, and Sf-Pi3 cell lines were detected using immunoblotting analysis. (b) Relative densitometry analysis of PHB2/actin. (c) Relative densitometry analysis of PHB1/actin. (d) The content of proVip3Aa-Flag in Sf-pIZT, Sf-Pi1, Sf-Pi2, and Sf-Pi3 cells was detected using immunoblotting analysis. Each cell line was pre-treated withproVip3Aa-Flag (20 μg/mL) for 2, 4, or 6 h. Lane 1, 5, and 9: Sf-pIZT cell line. Lane 2, 6, and 10: Sf-Pi1 cell line. Lane 3, 7, and 11: Sf-Pi2 cell line. Lane 4, 8, and 12: Sf-Pi3 cell line. (e) Relative densitometry analysis of proVip3Aa/actin. (f) The proVip3Aa-RFP dots in each cell line were observed by a confocal microscopy. Each cell line was pre-treated with Vip3Aa-RFP (5 μg/mL) for 6 h and FITC-phalloidin (green) was used to stain cell membrane. Scale bar, 10 μm. (g) Using a blind fashion to quantitate the number of conspicuous Vip3Aa-RFP dots in each cell line (n = 50 cells per sample). Data are expressed as the mean ± SD from three independent experiments; ns, non-significant; * p < 0.05, ** p < 0.01, and ***p < 0.001.
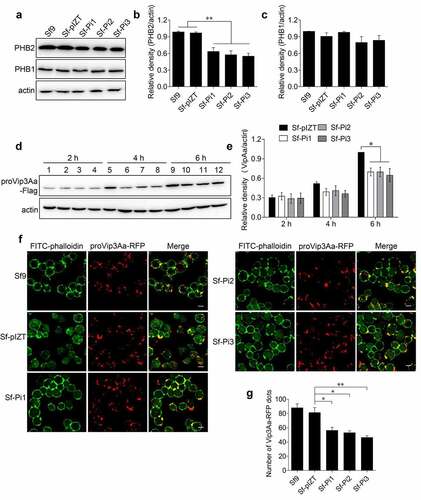
Figure 4. PHB2 affects mitochondrial function. (a) Cell viability of each cell line exposed to 50 μg/mL of proVip3Aa or 30 μg/mL of actVip3Aa for 48 h. Ns, non-significant; * p < 0.05, ** p < 0.01. (b) ROS levels of Sf-pIZT, Sf-Pi1, Sf-Pi2, and Sf-Pi3 cell lines exposed to 50 μg/mL of proVip3Aa for 24 h and DCFH-DA was used to detect the ROS level. Scale bar, 20 μm. (c) Relative fluorescence intensity of DCFH-DA in Sf-pIZT, Sf-Pi1, Sf-Pi2, and Sf-Pi3 cell lines. (d) Mitochondrial membrane potential of Sf-pIZT, Sf-Pi1, Sf-Pi2, and Sf-Pi3 cell lines exposed to 50 μg/mL of proVip3Aa for 24 h and Rhodamine 123 was used to detect the mitochondrial membrane potential. Scale bar, 20 μm. (e) Relative fluorescence intensity of Rhodamine 123 in Sf-pIZT, Sf-Pi1, Sf-Pi2, and Sf-Pi3 cell lines. (f) Immunoblotting analysis of the subcellular distribution of cytochrome c in Sf-pIZT, Sf-Pi1, Sf-Pi2, and Sf-Pi3 cell lines.
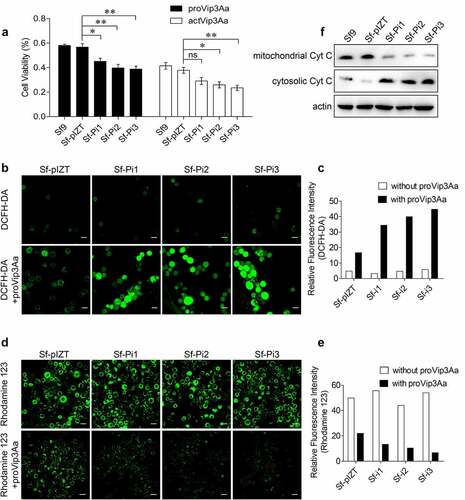
Table 1. Primers used in this study
Supplemental Material
Download Zip (1.2 MB)Data availability statement
The authors confirm that the data supporting the findings of this study are available within the article and its supplementary materials.